Introduction
The dashboard has never been what we hoped it would be, and thanks to your feedback, we will be releasing a new version of the dashboard in the coming months. We really need your help to make sure that we don't overlook anything and provide the best experience for teachers and students.
I'm looking for people to share the new dashboard with, so if you can spare a few minutes, please let me know (mike@theeverlearner.com) and I can show you what we have so far. I would really appreciate hearing from people to make sure that we get it right!
Please note, the images here are just wireframes to show the outline, not final designs.
What was the feedback?
+ The dashboard has most of the information teachers need
+ The dashboard helps to identify gaps in students' knowledge
- The dashboard is not easy to navigate
- The dashboard does not have an overview of all students in a group
- There are too many clicks to find the relevant information
- When more groups are added, the left-hand menu is too long
What does the new dashboard look like?
The dashboard will have 2 navigation options. The left-hand menu allows you to choose the type of data you want to look at:
Completion: The is measuring where the students are now. It shows Live Score, Percentage of Tutorials Watched, TIme Spent Testing, Time Spent Studying
Progress: This is showing the journey students have been on to arrive where they are now. You can look at progress over any time period.
Checkpoints: This shows the number of assignments set and the completion rate as well as the individual scores for each checkpoint.
Assignments: This is a mark book showing the assignment completion for each student, group or subject.
The filters found on each page allow you to 'zoom in and out' of the data to look at the level of Subject, Qualification, Group, Course or Individual. This means you can see trends and averages, but also an individual student's attainment.
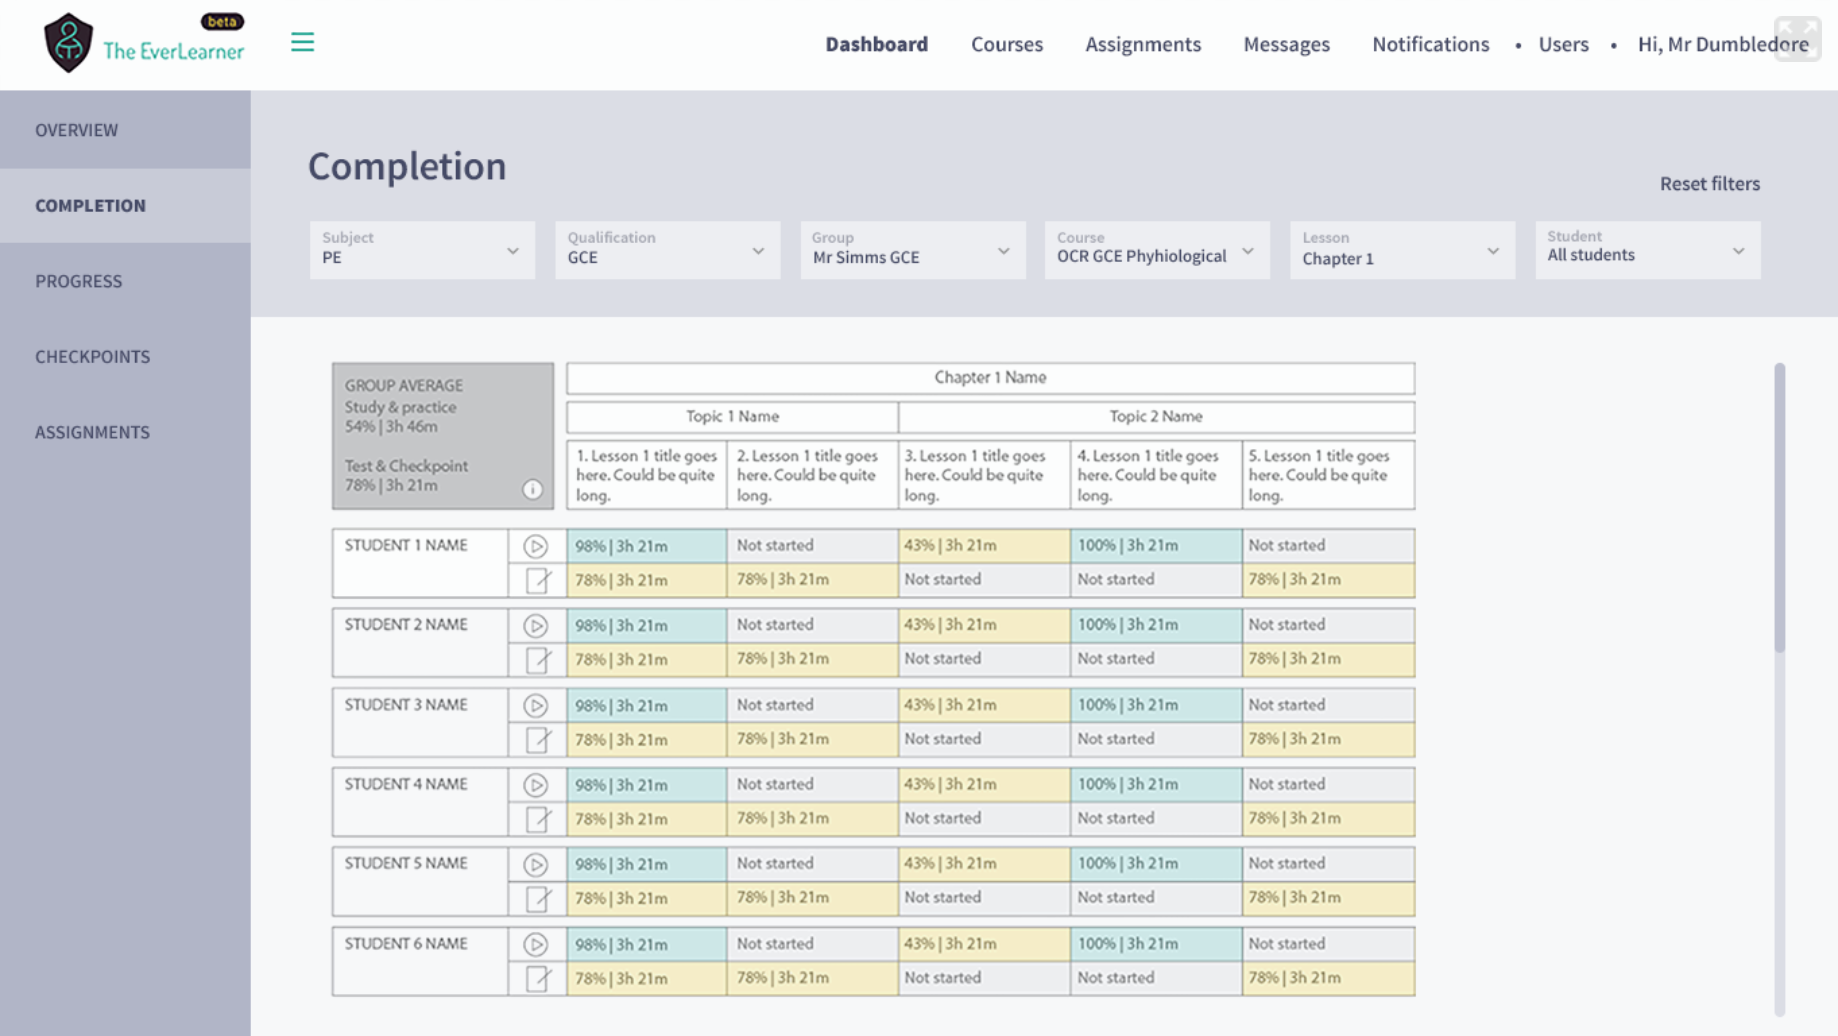
Completion:
This section is all about current achievement. It shows data on live scores, the percentage of tutorials watched, time spent practising and time spent testing.

There are 6 filters which allow you to choose which data you want to look at:
Subject (If you are assigned to more than one subject, you choose the subject here). This will show you an overview of all the groups in that subject.

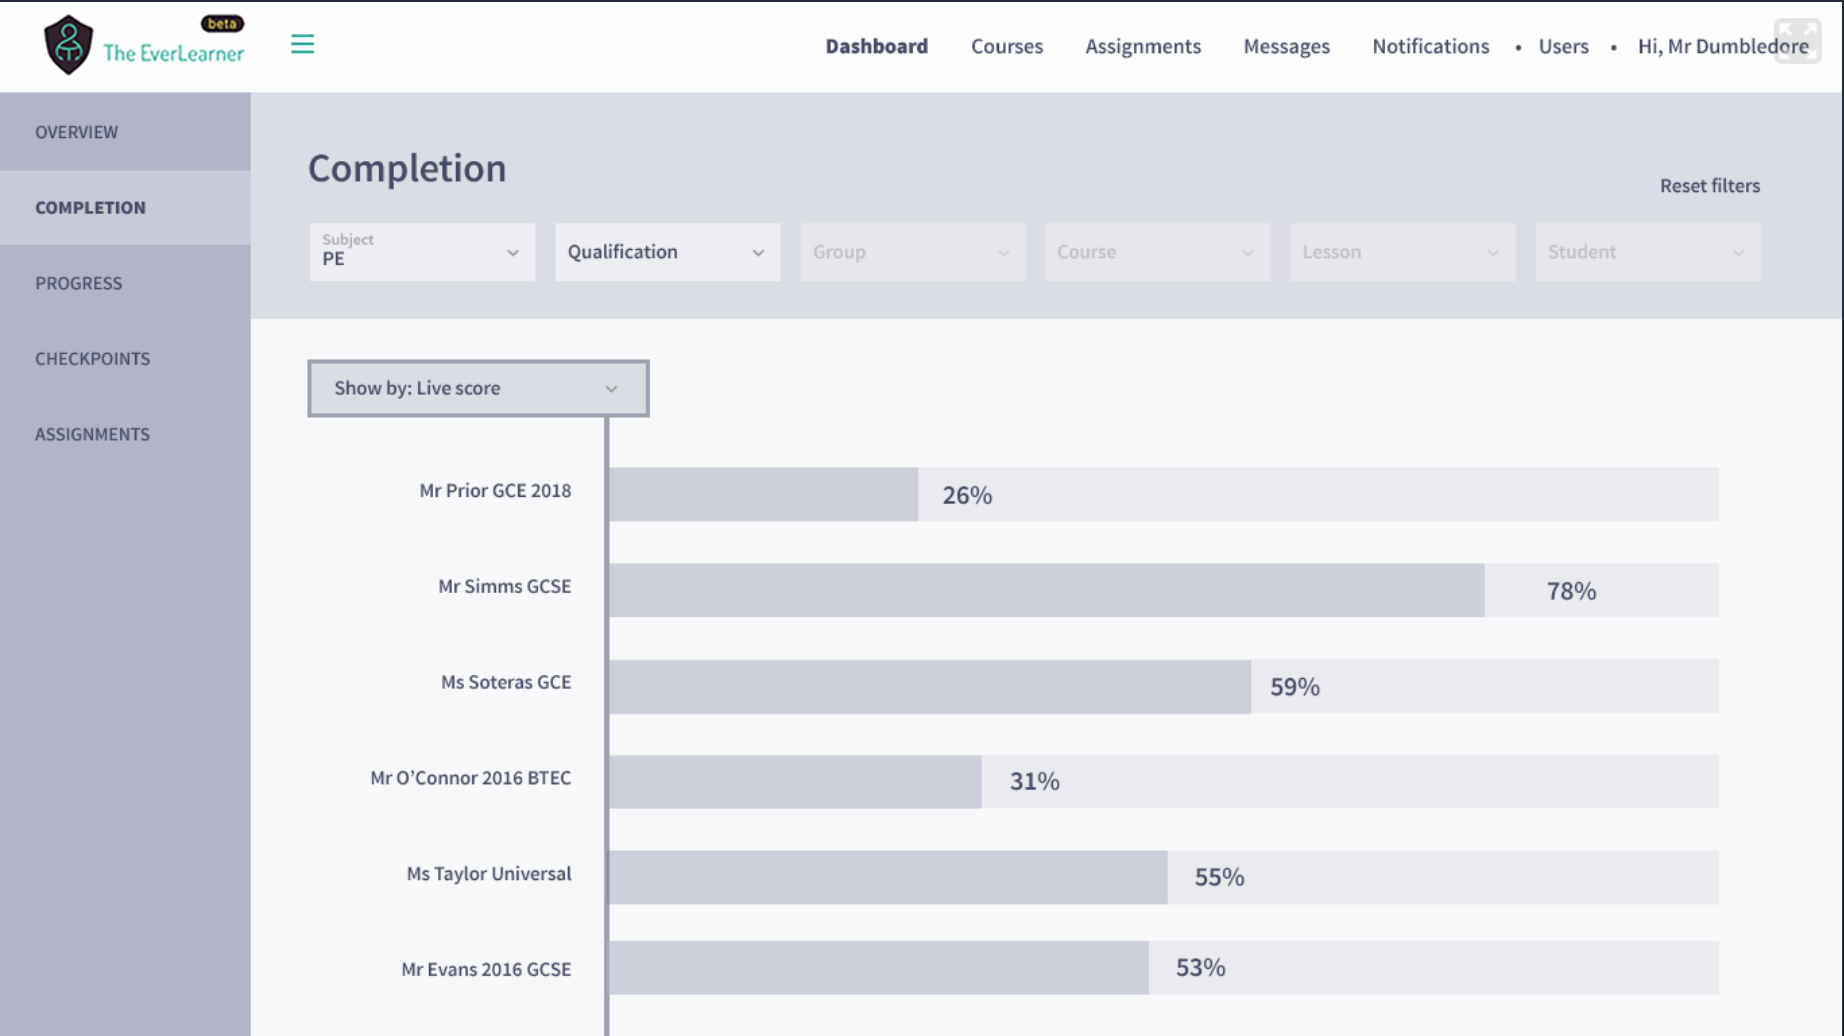
Qualification (choose GCSE, GCE, BTEC, CTEC, VCERT etc). This will show you a comparison of all of the groups within that qualification type.

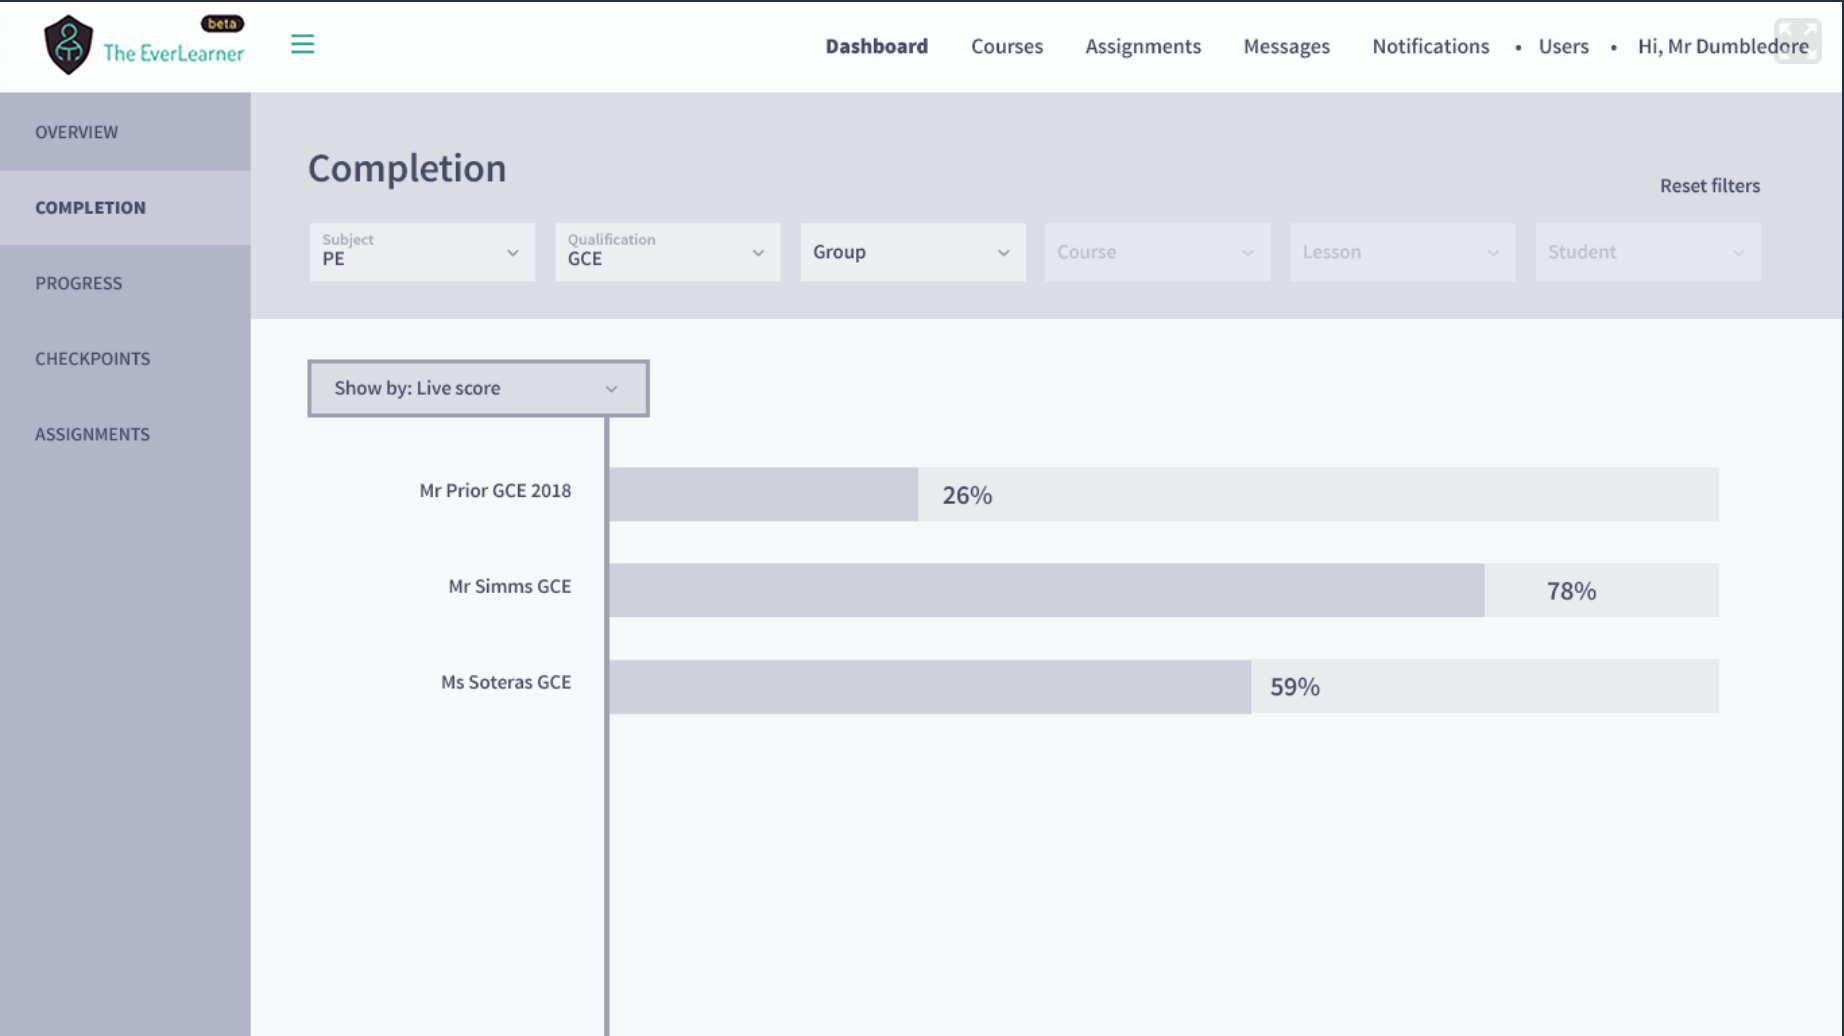
Group. This will show you the courses which that group are enrolled to, and how each course compares to one another.
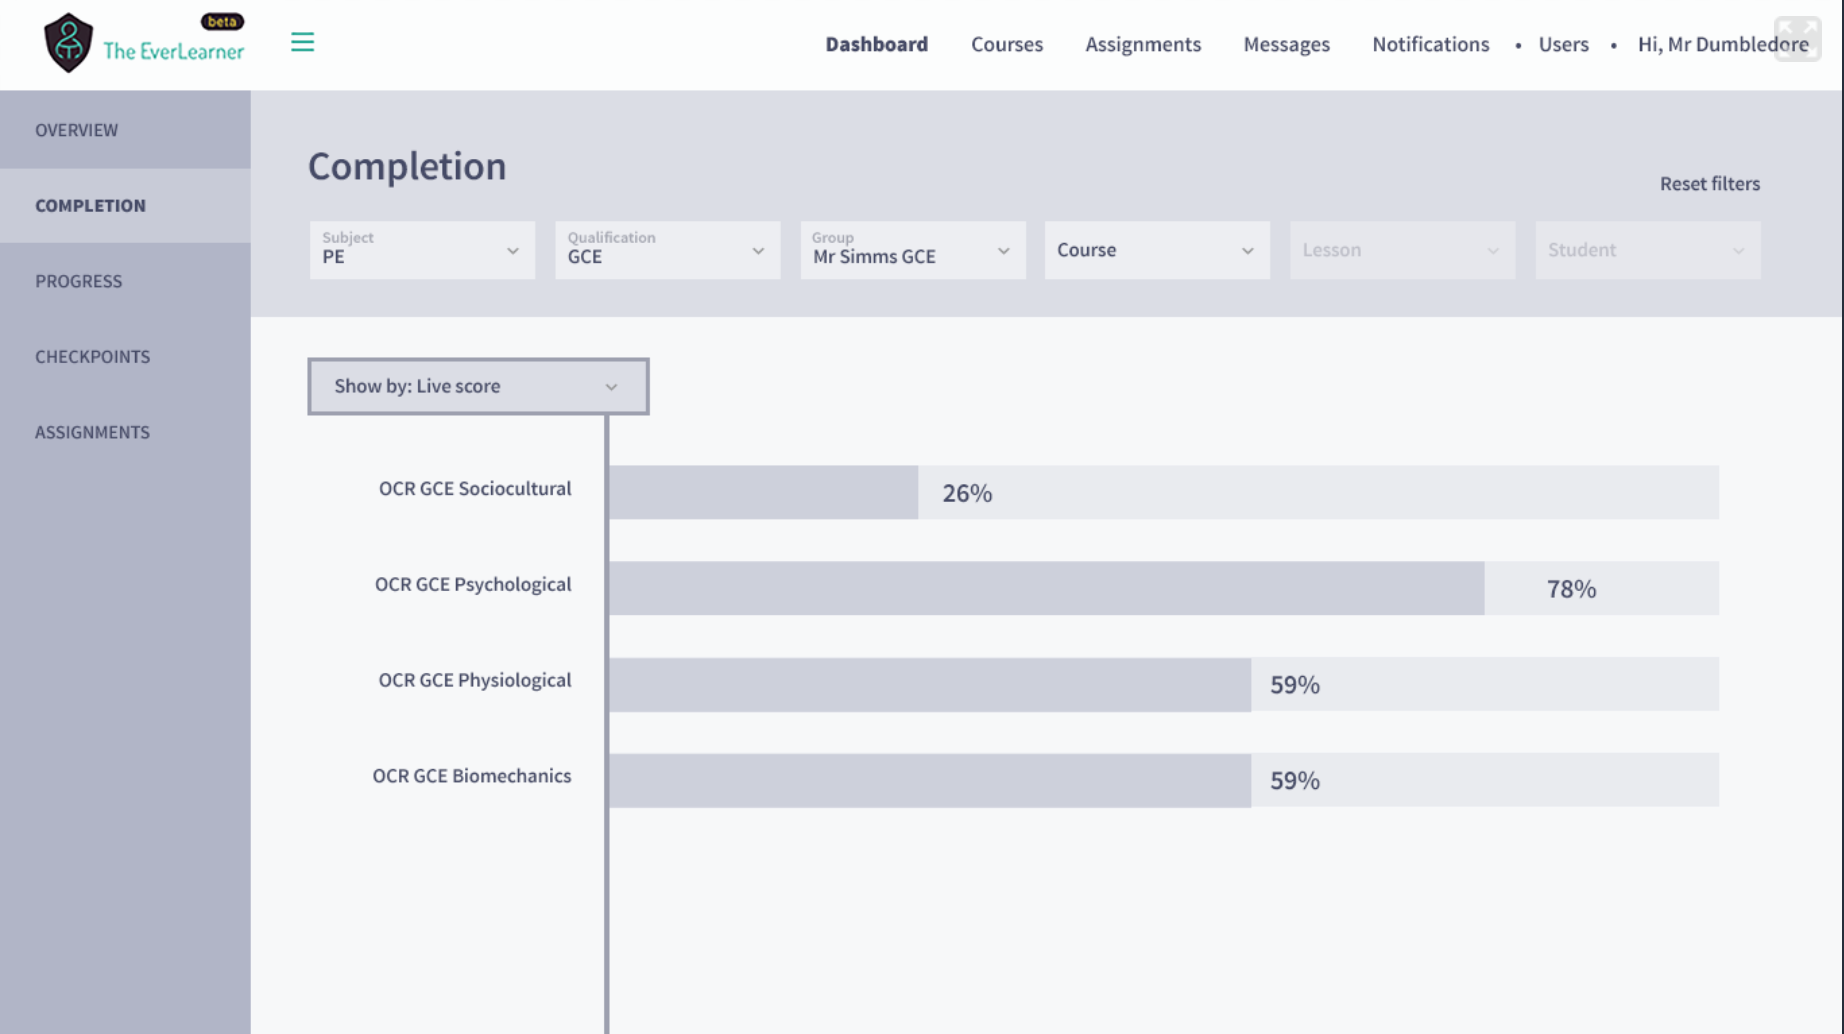
Course. This shows the entire course for a group as an overview. You can see the students on the left-hand side, and each lesson in the course across the top.

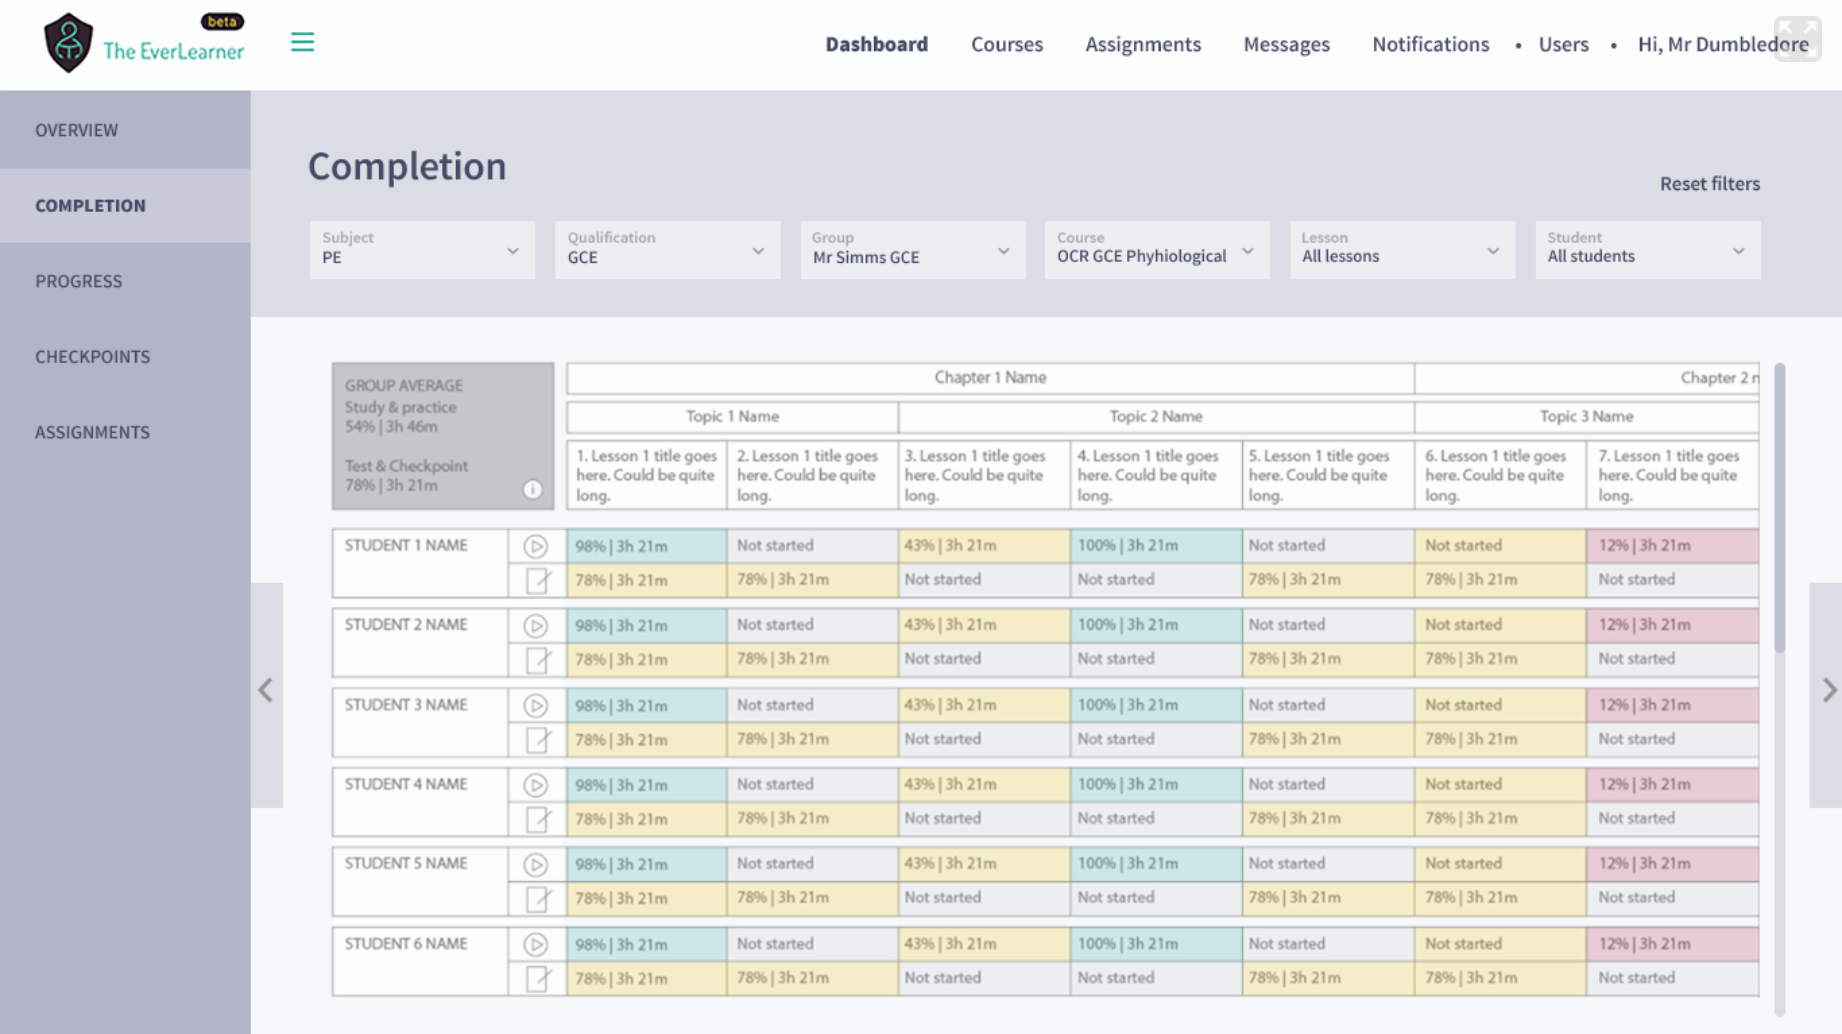
Lesson: Choose to look at any number of lessons side by side.
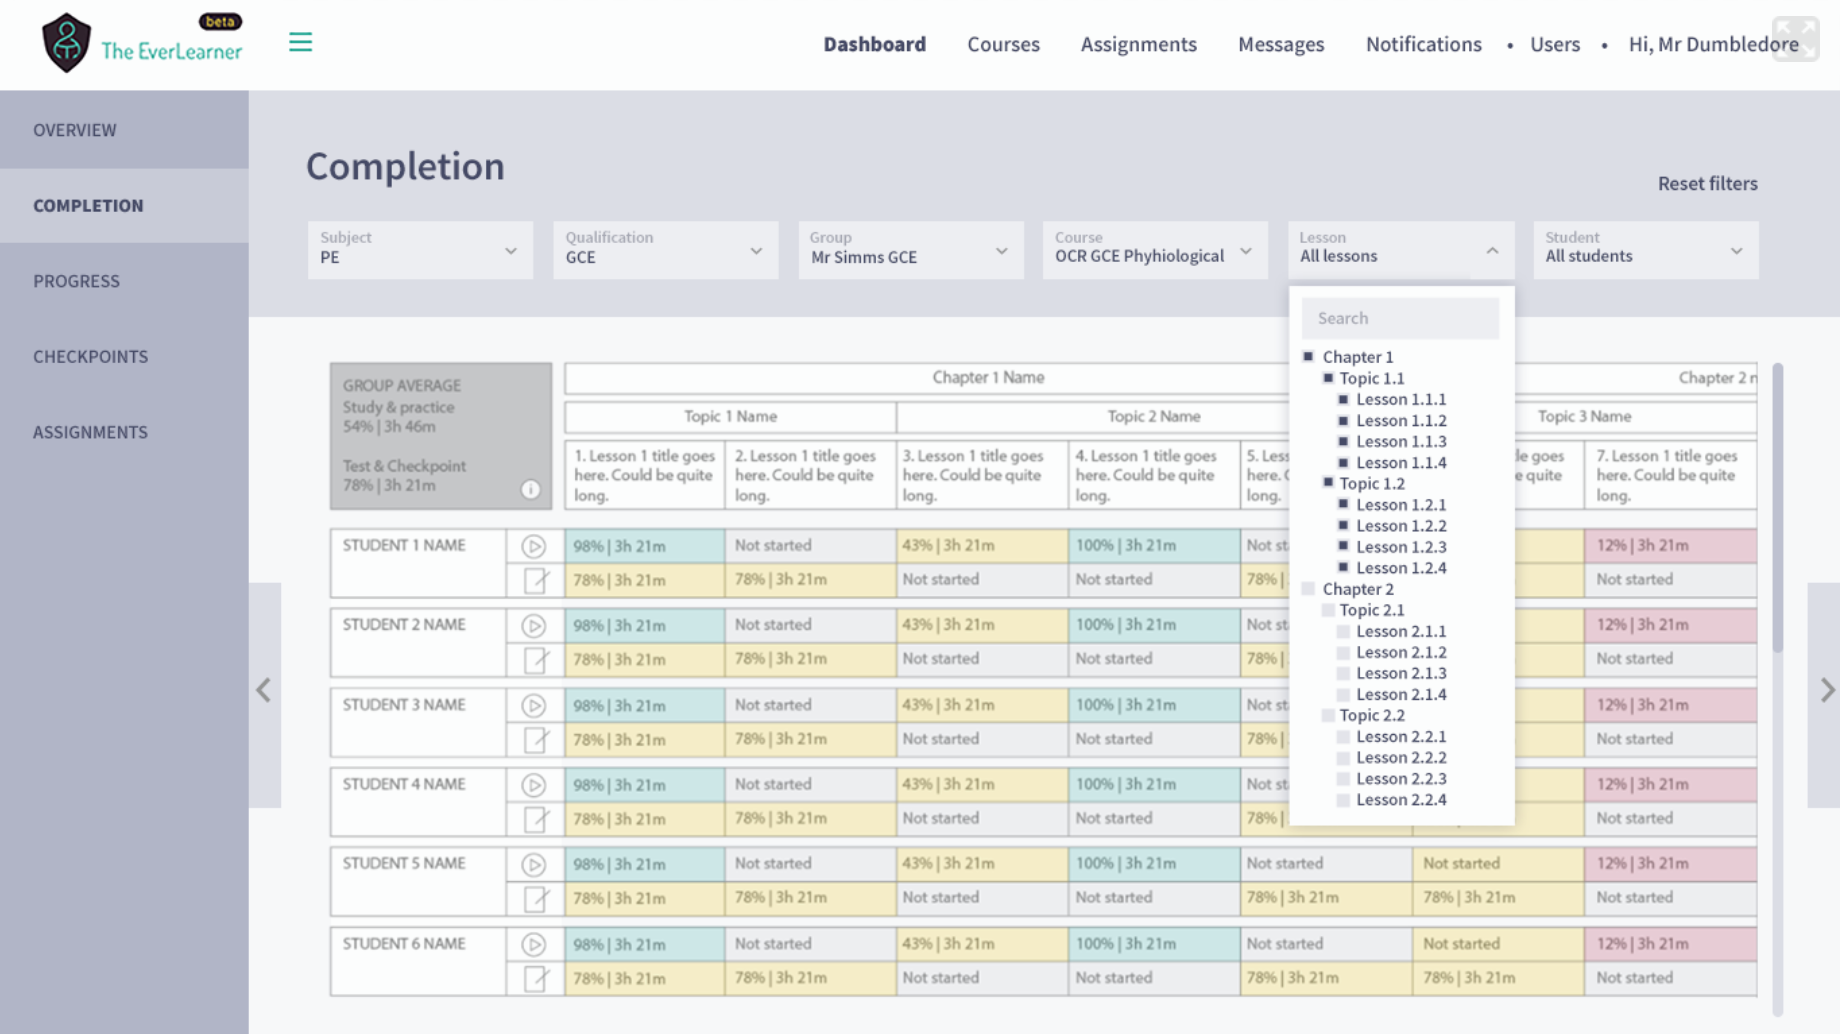

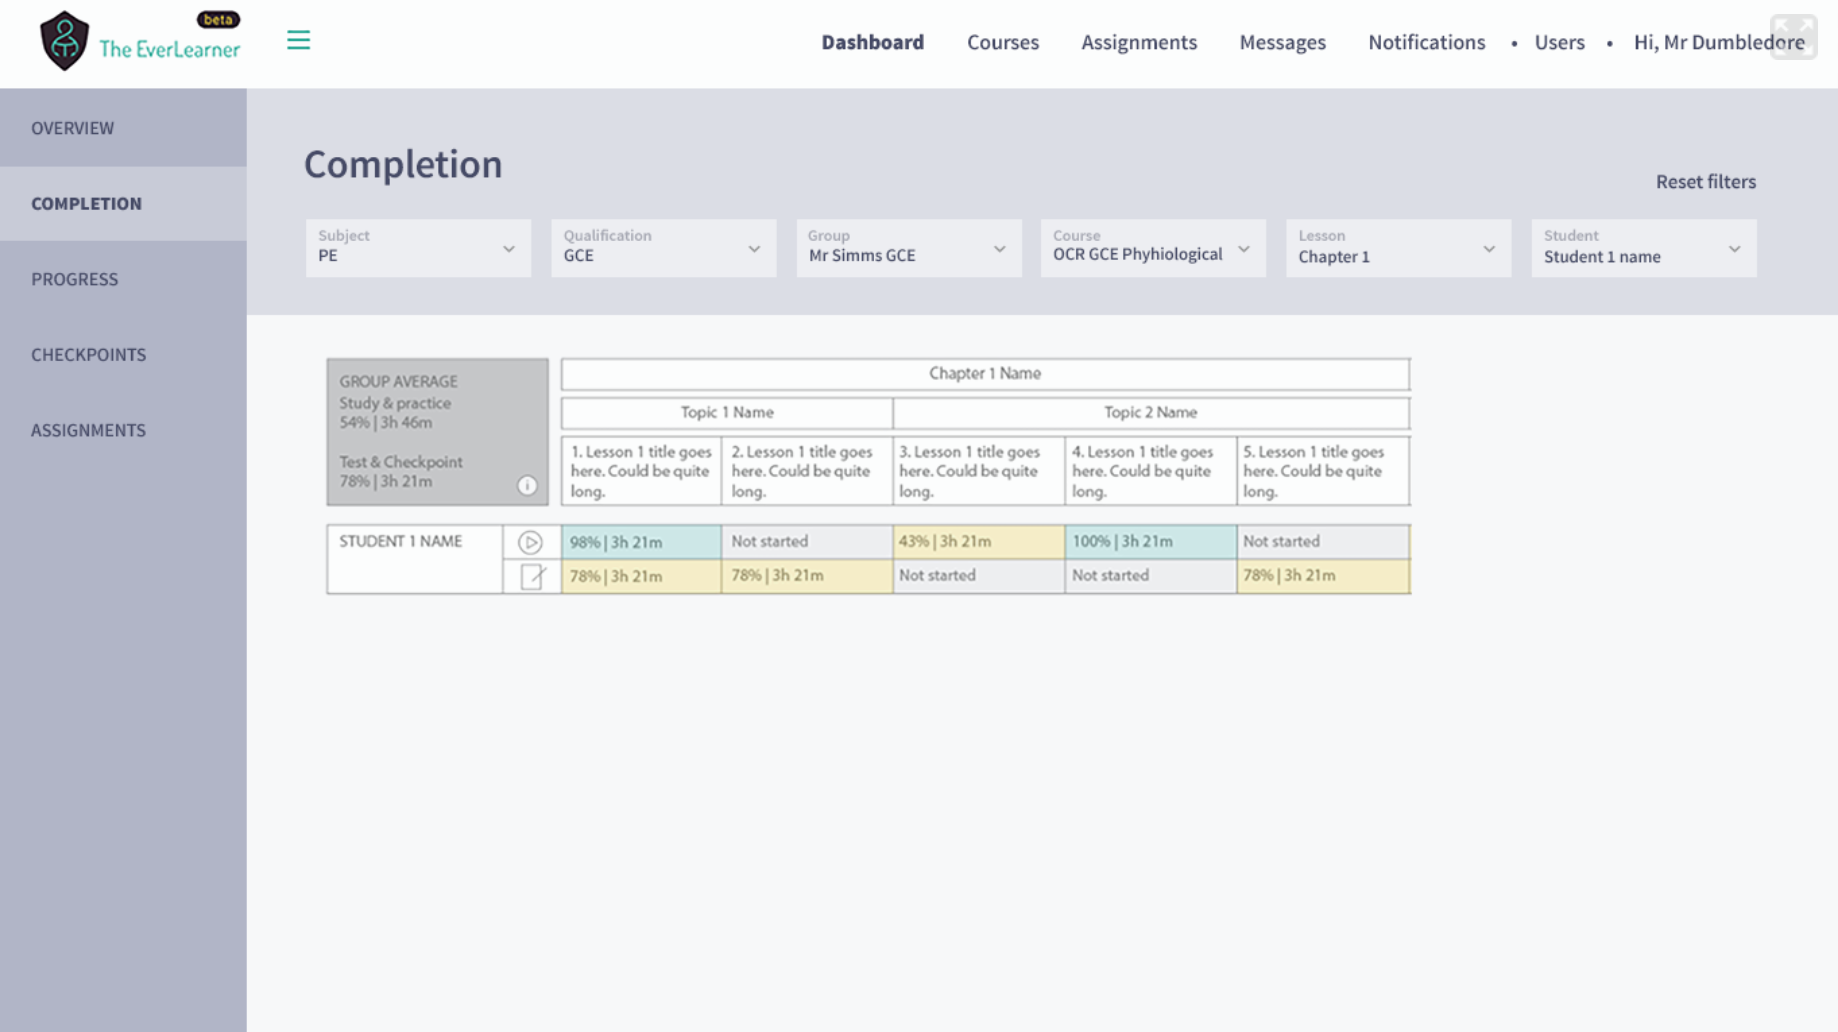
Student: Focus on individuals or look at the whole group.
Progress:
Progress shows how a student has performed over time. You can choose to look at the students' progress in terms of live score, tutorials completed, time spent practising and time spent testing.
Choose the subject to see the progress of all groups in that subject.
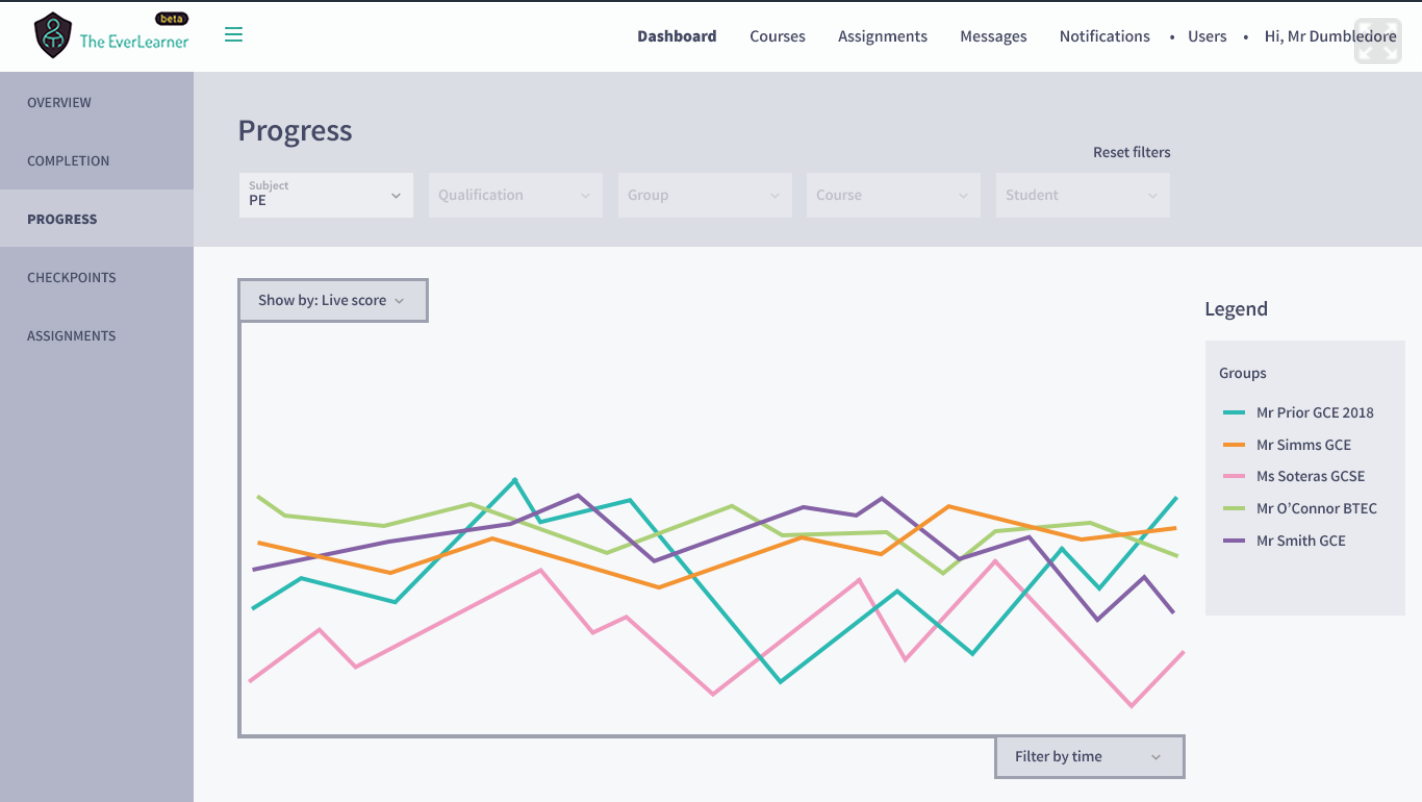
Choose the qualification to compare groups studying at the same level.
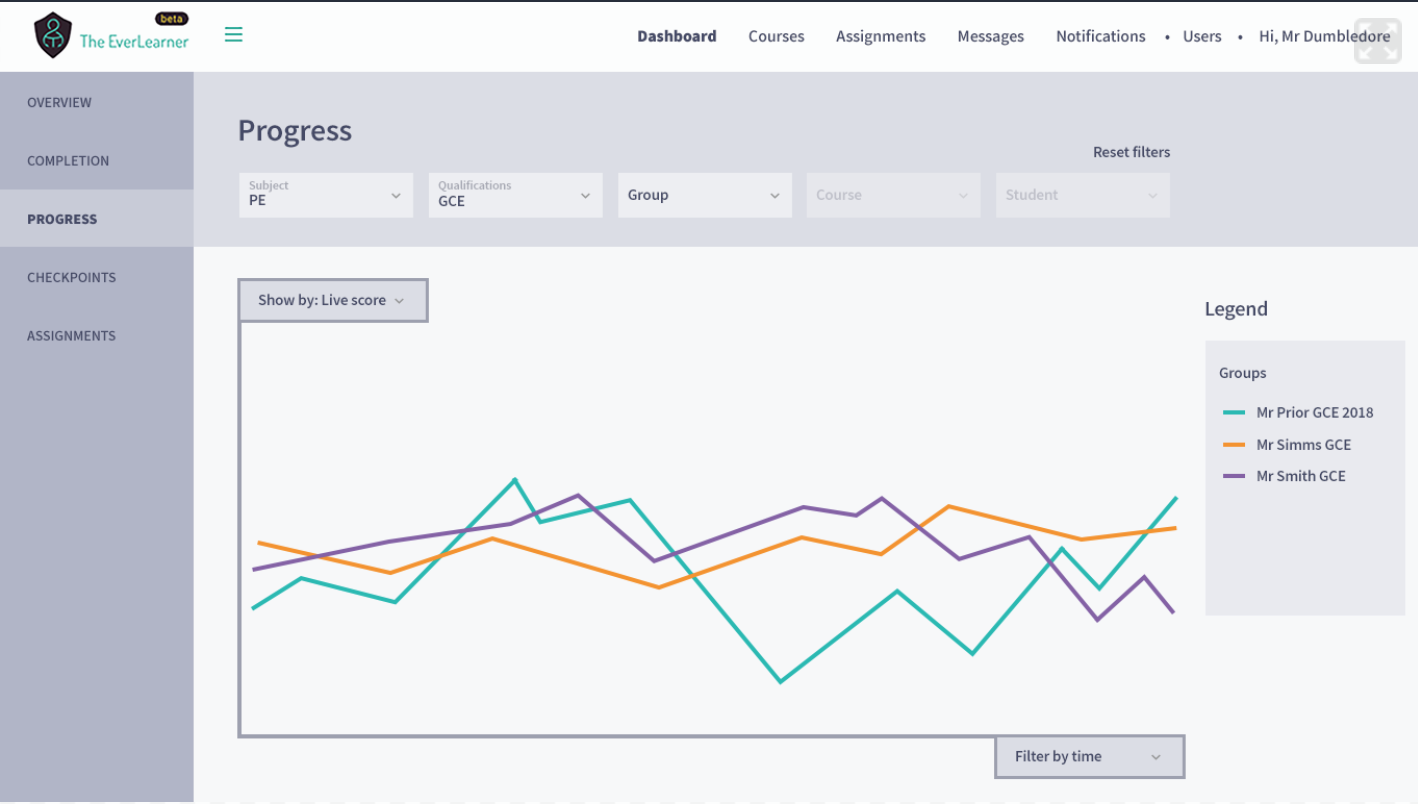
Choose the group to see the progress of the courses that the group is studying.
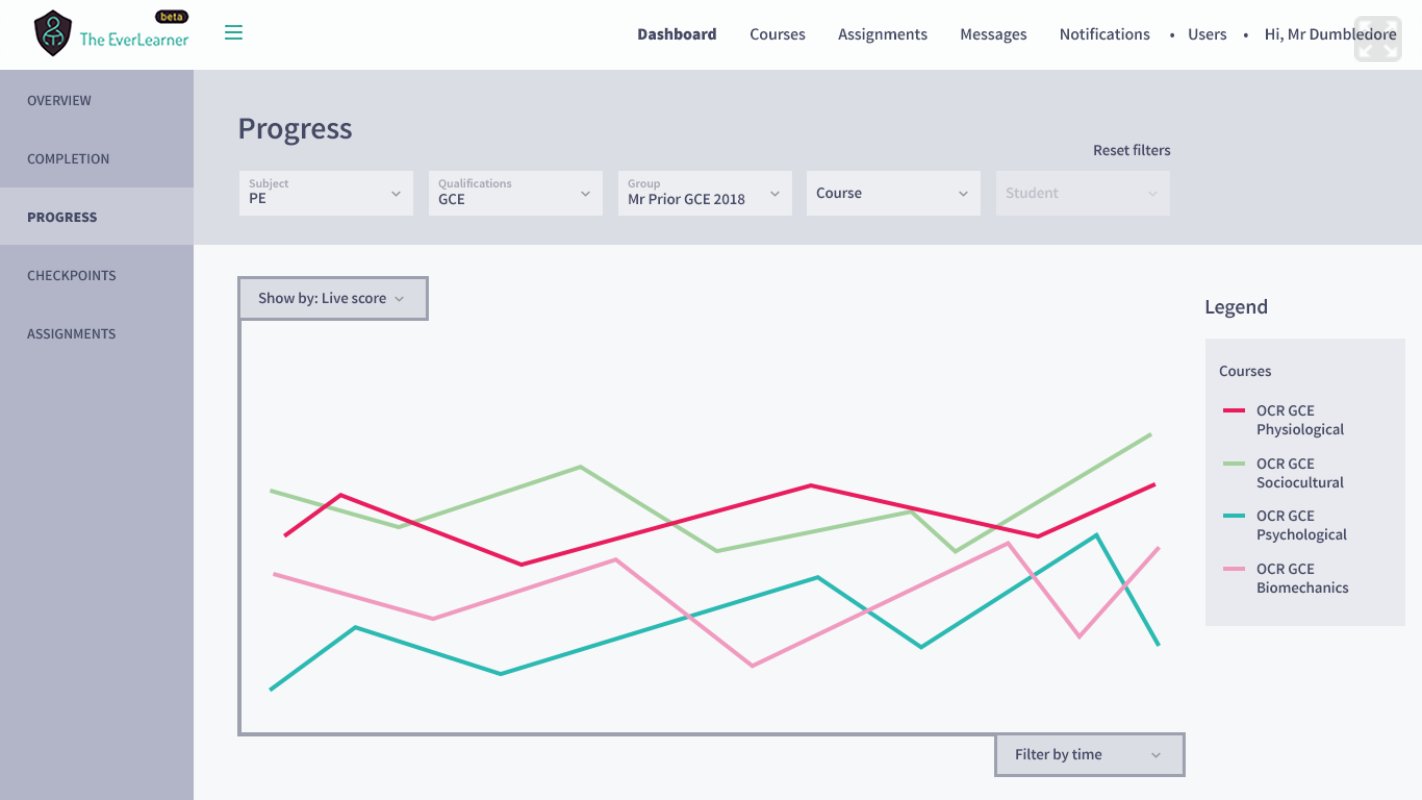
Choose the course to see the progress of each student studying that course.
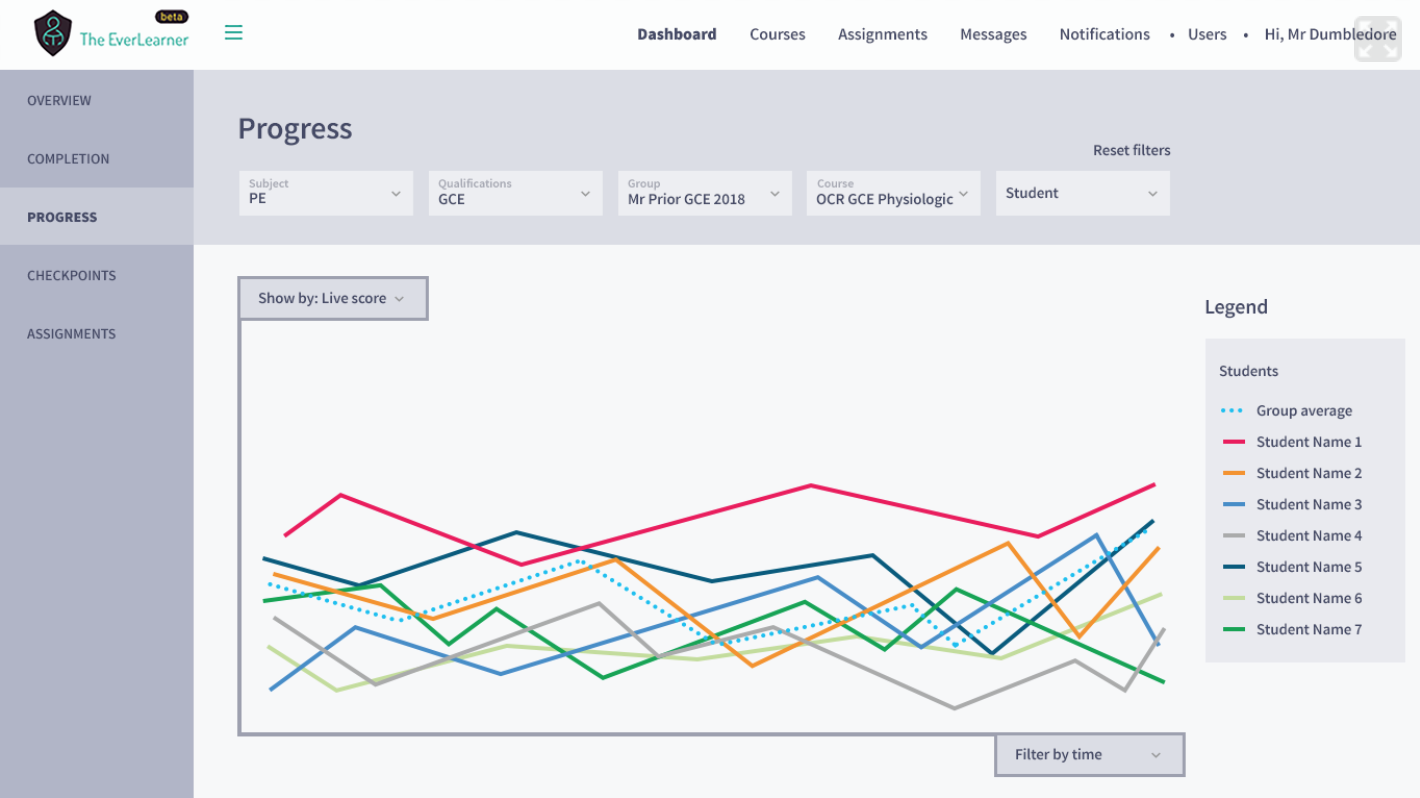
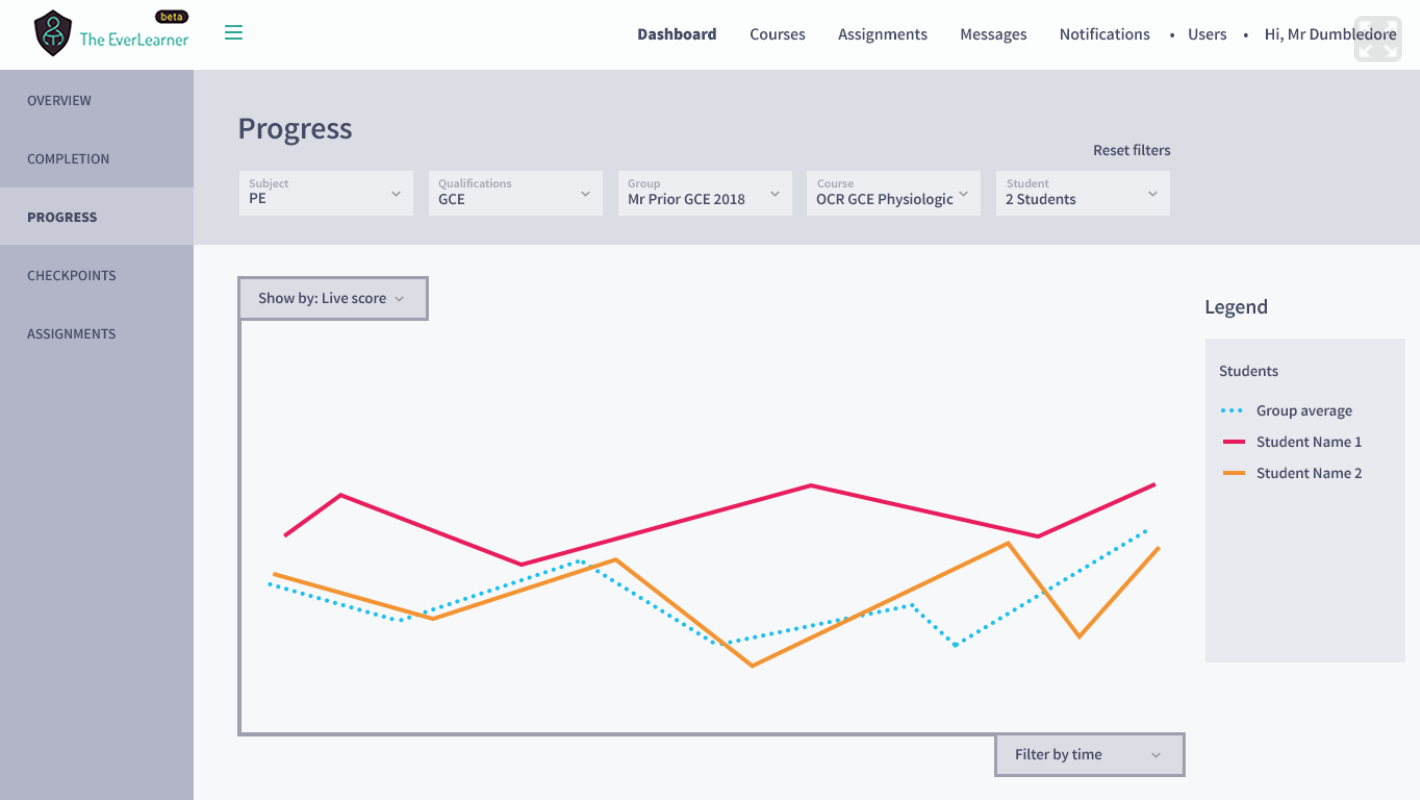
Choose specific students to see how individuals or sub-groups compare to the group average.
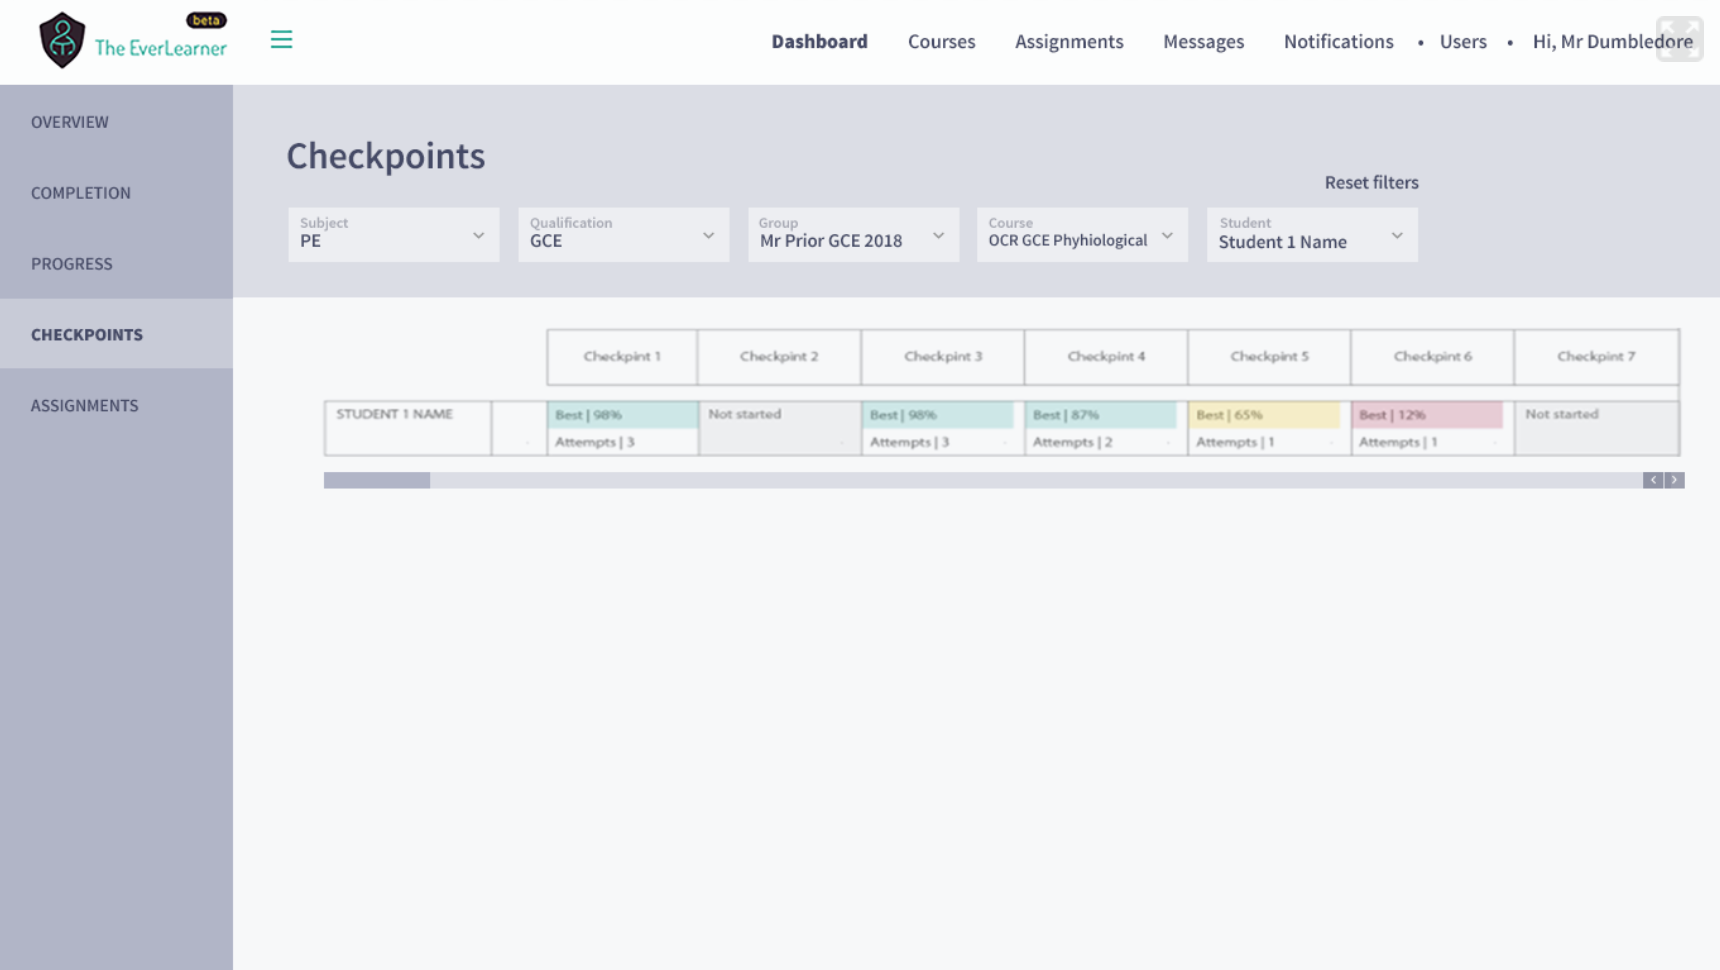
Checkpoints:
Checkpoints are like end of unit tests. You can see checkpoint results at all levels by using the same filters.
Choose the subject to see the checkpoints of all groups in that subject.
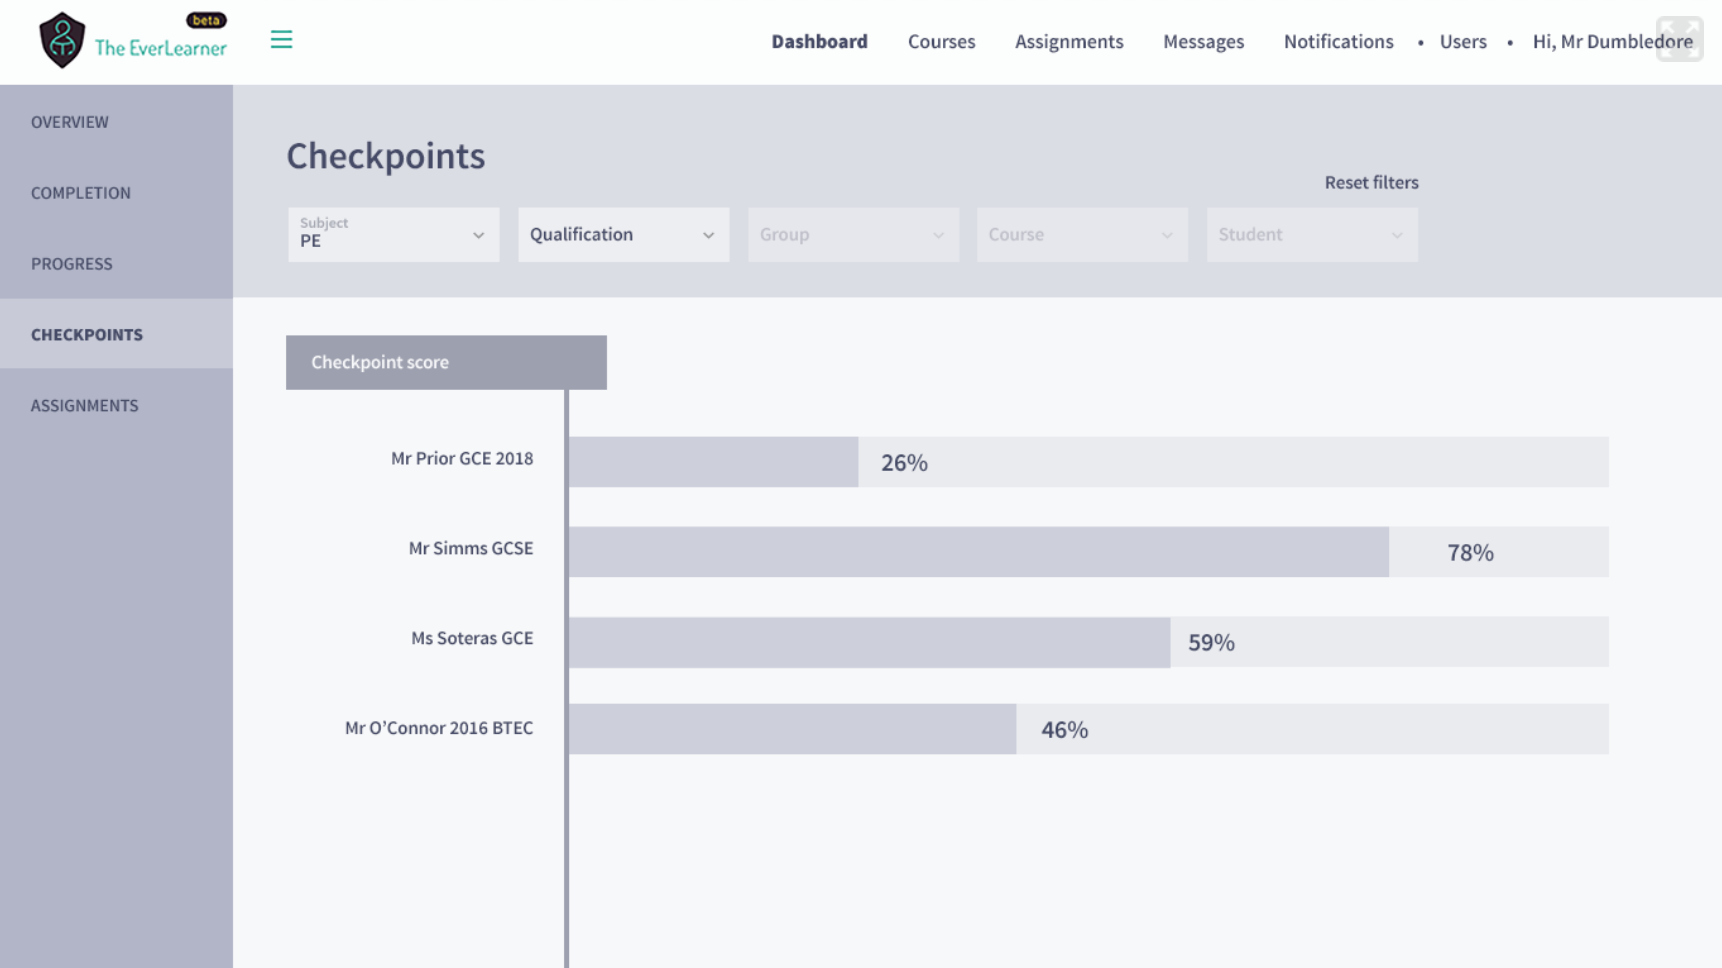
Choose the qualification to see the checkpoint results for groups within a qualification type.
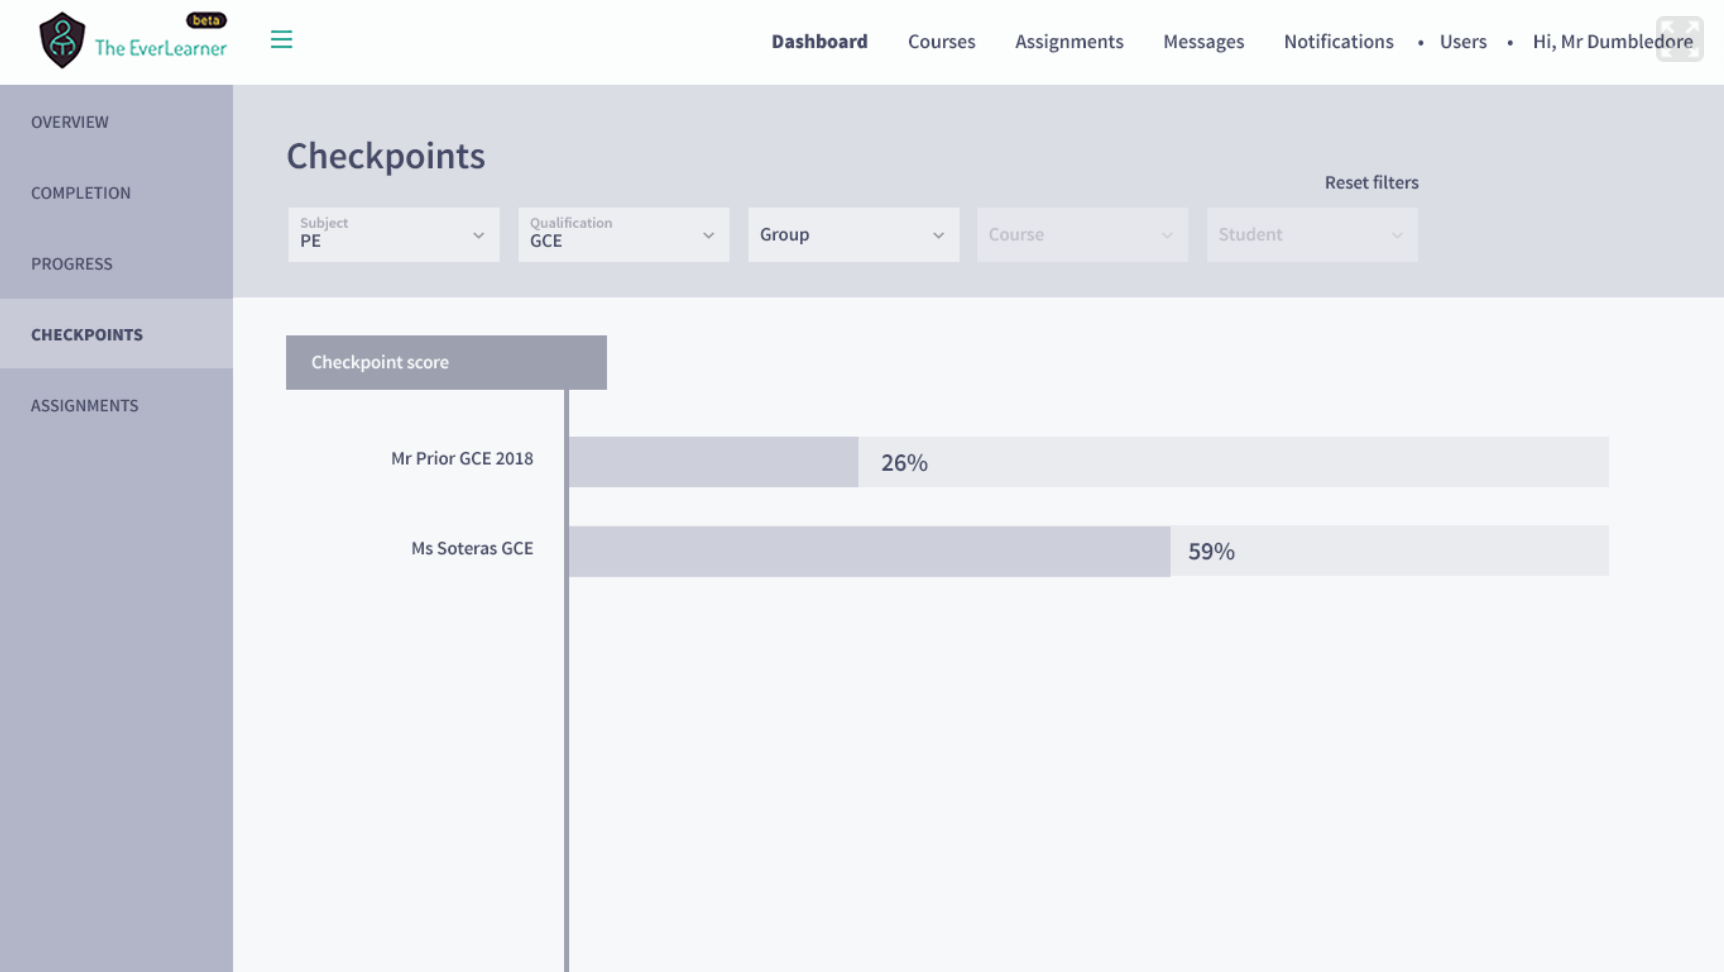
Choose the group to see checkpoint results by course in that group.
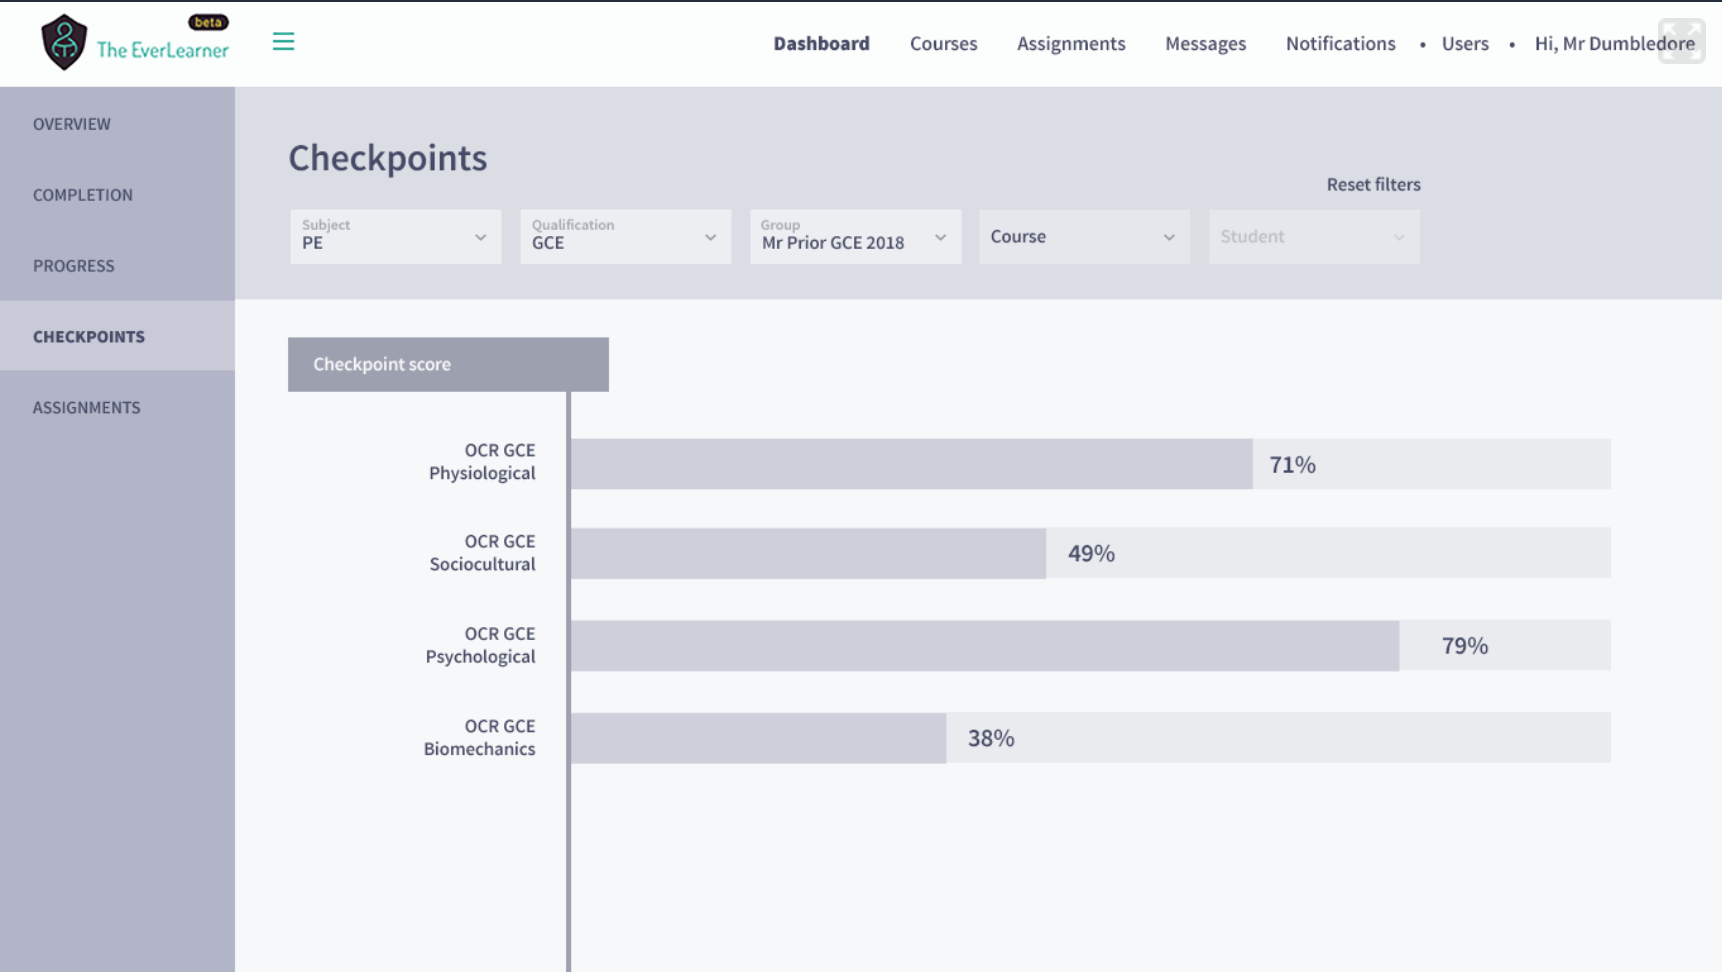
Choose the course to see checkpoint results of students in that group.
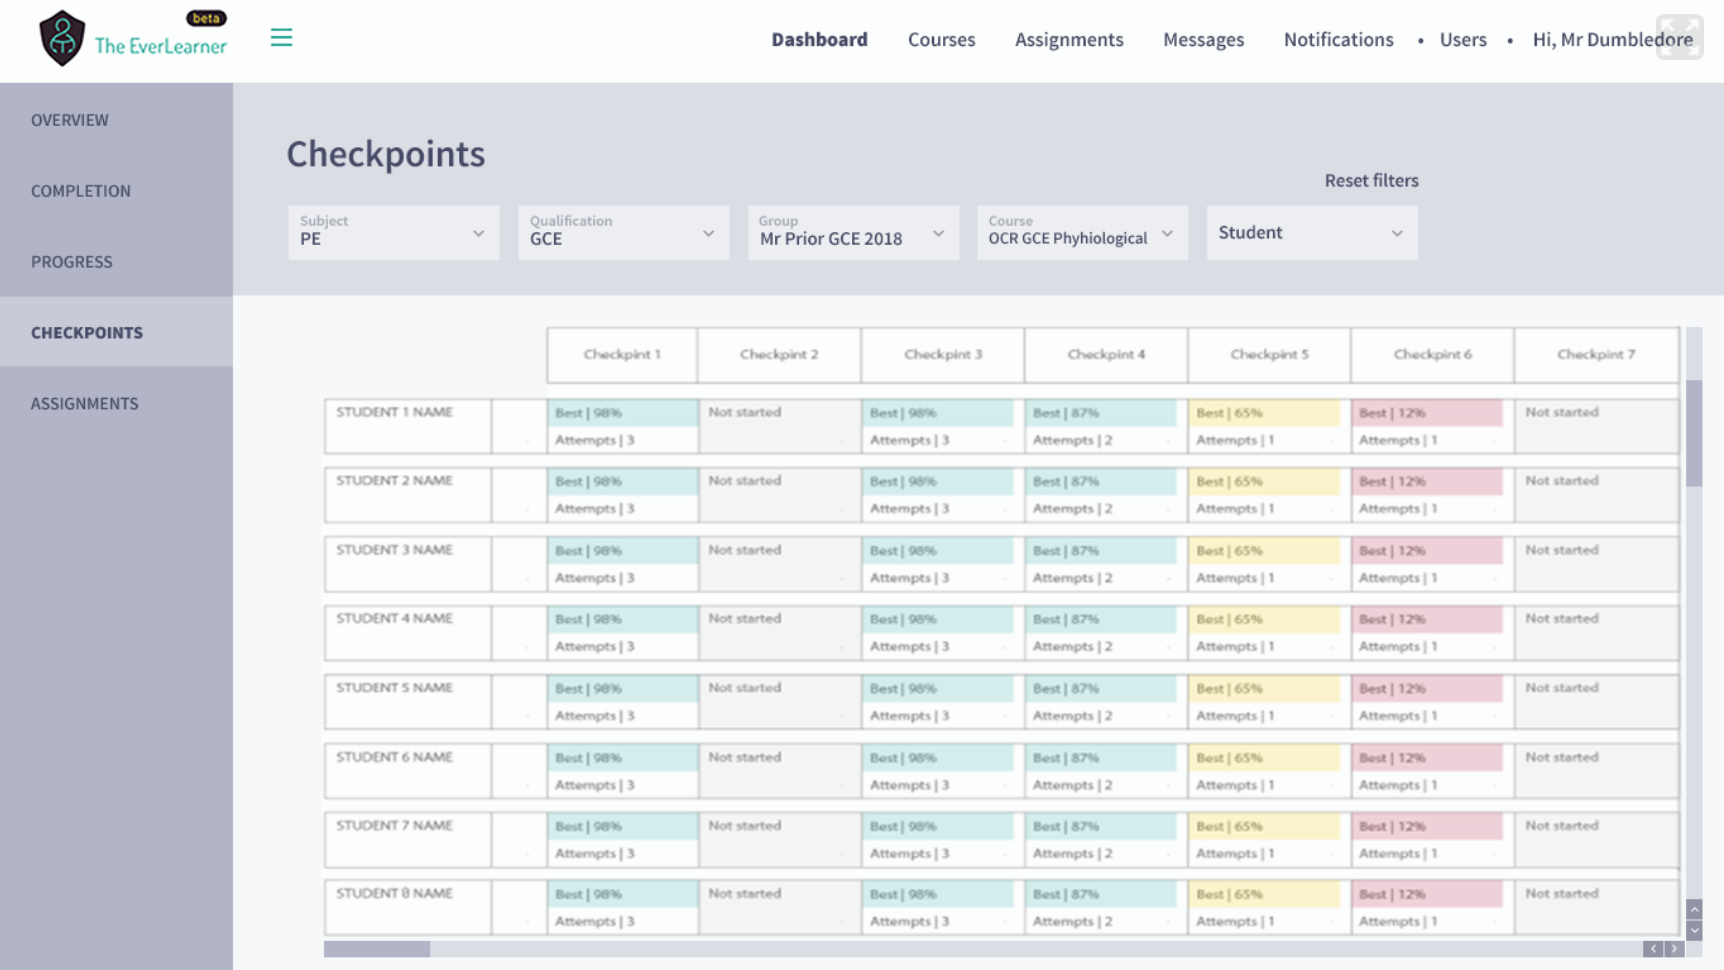
Filter by a student.
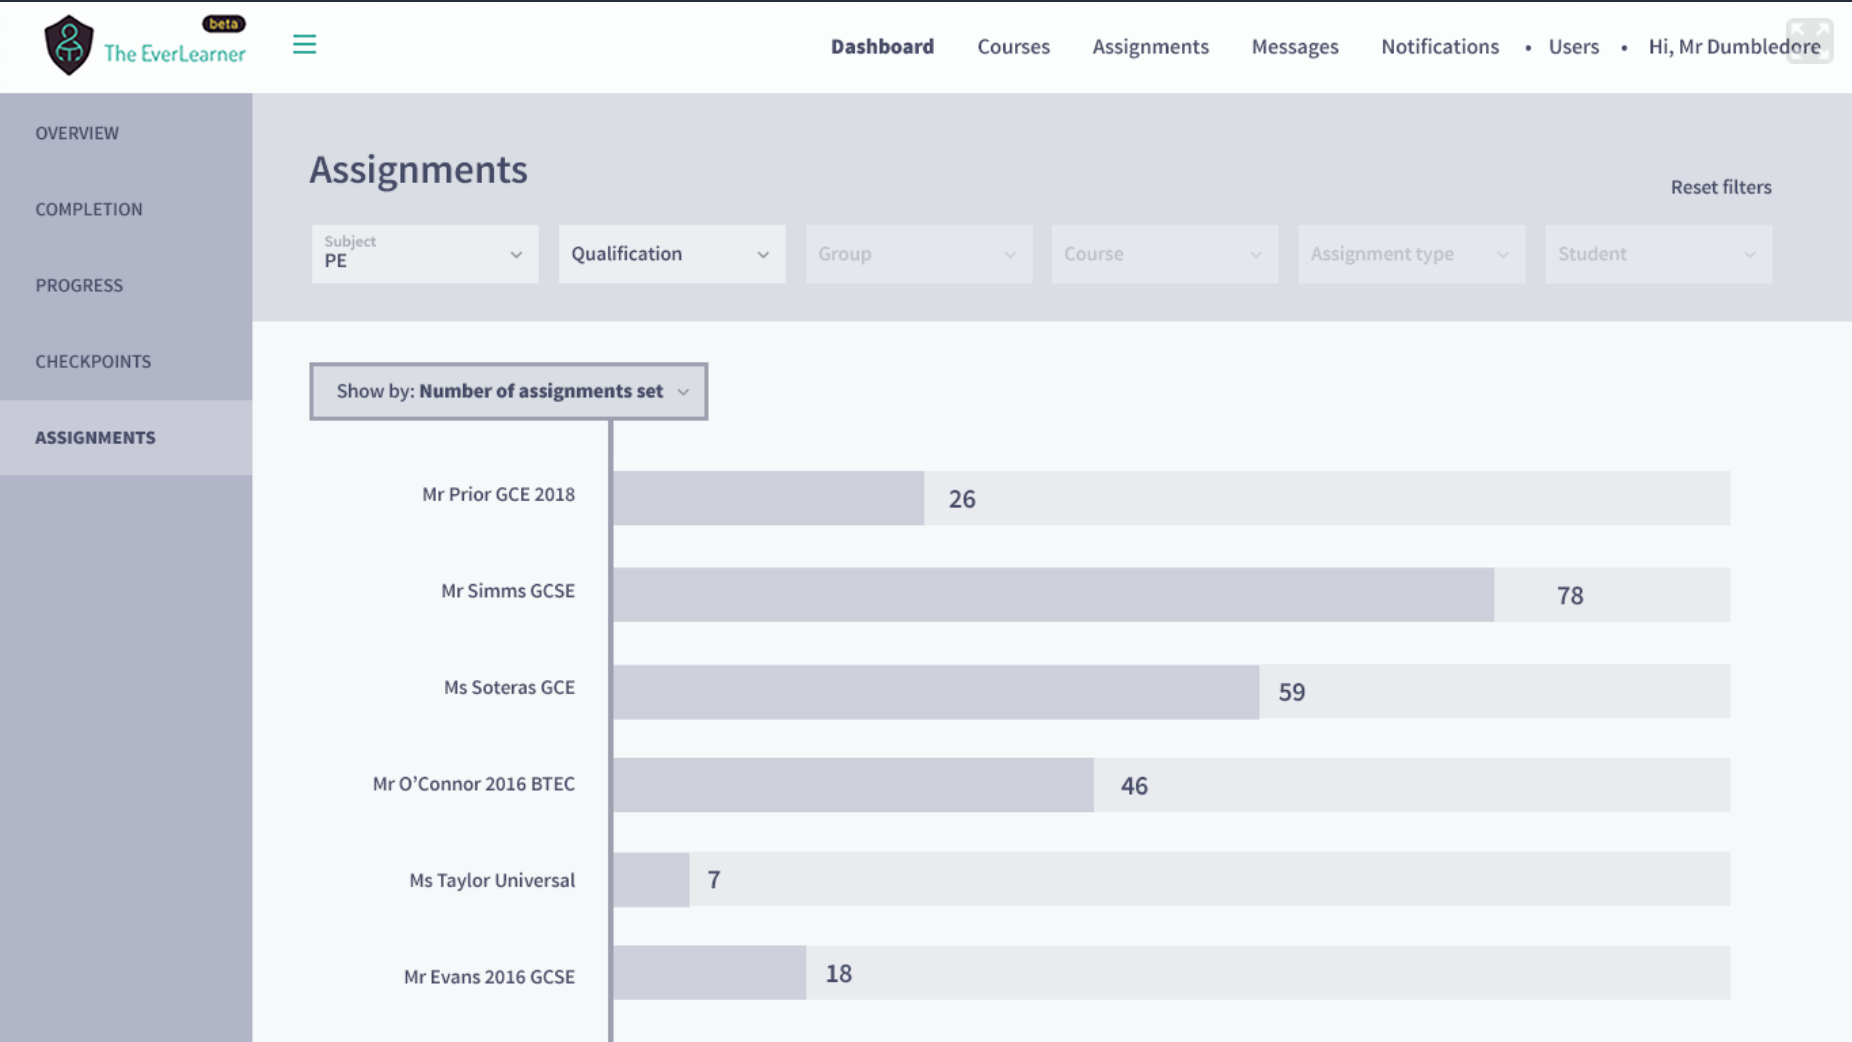
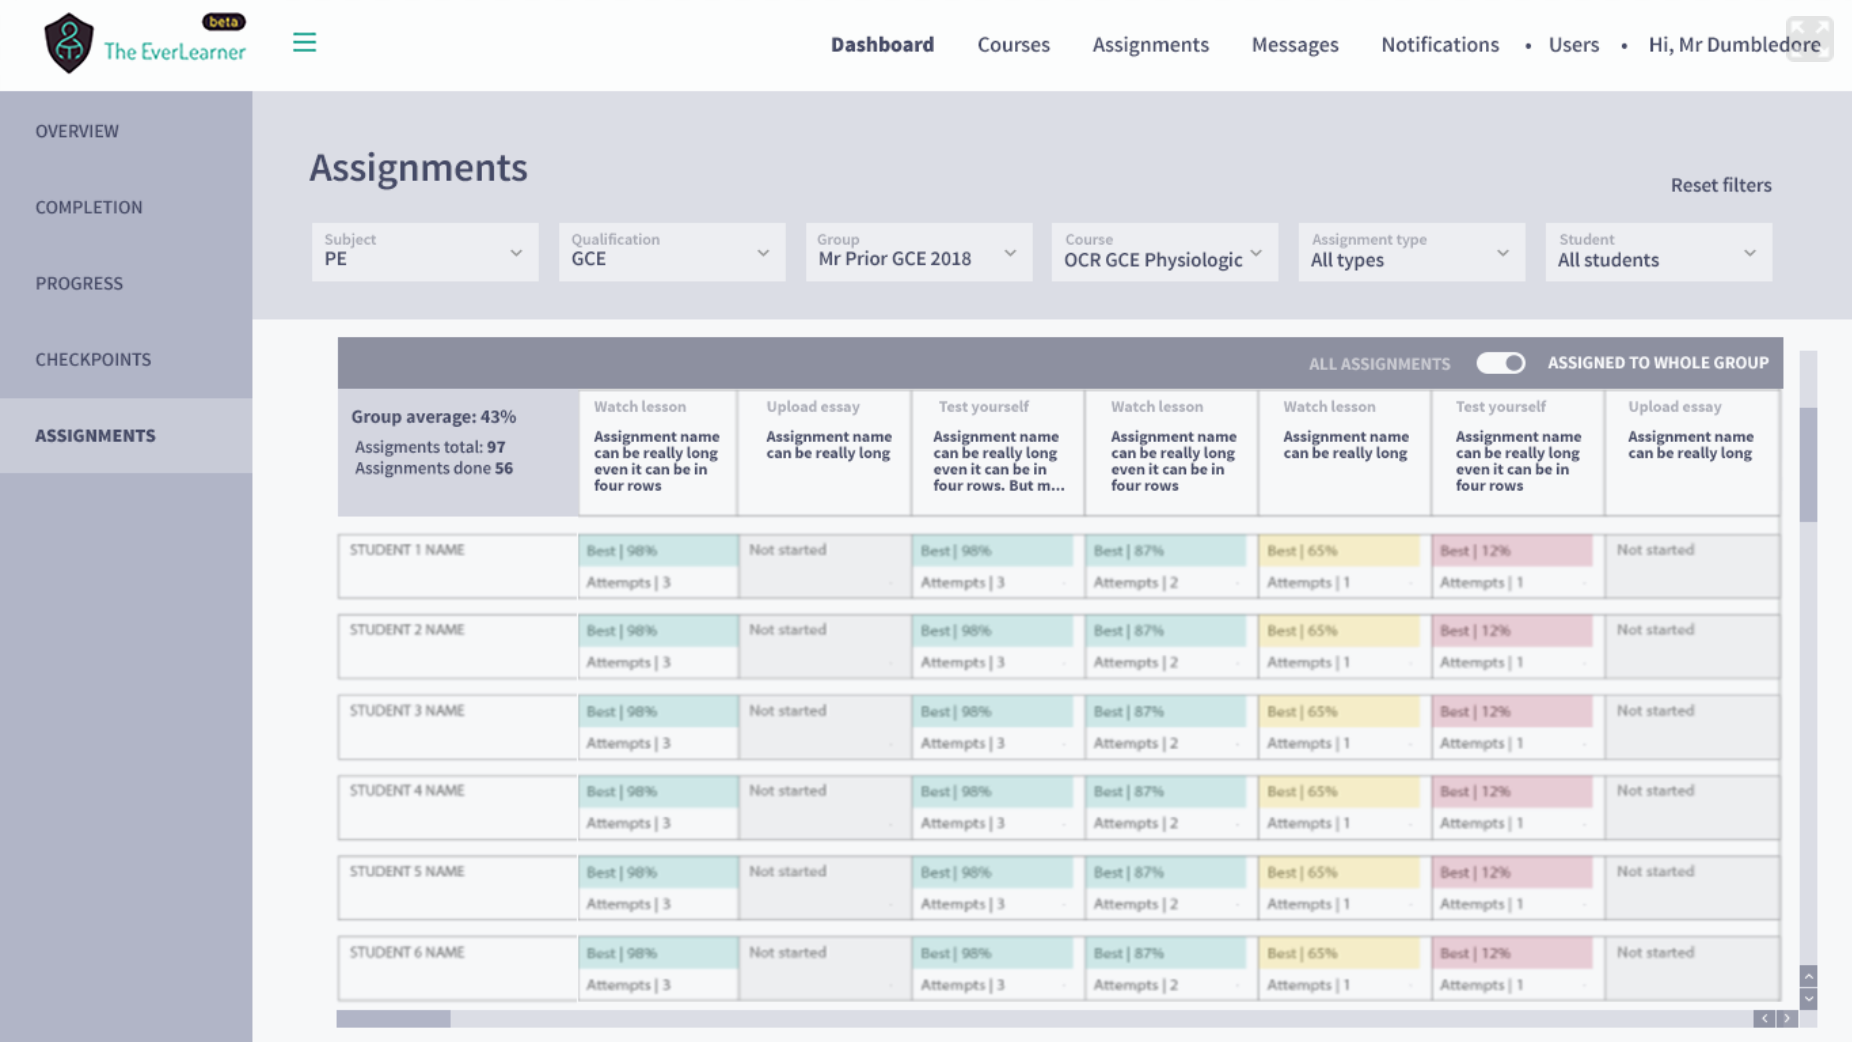
Assignments:
You can see checkpoint results at all levels by using the same filters.
Choose the subject to see the checkpoints of all groups in that subject.
Then choose qualification:
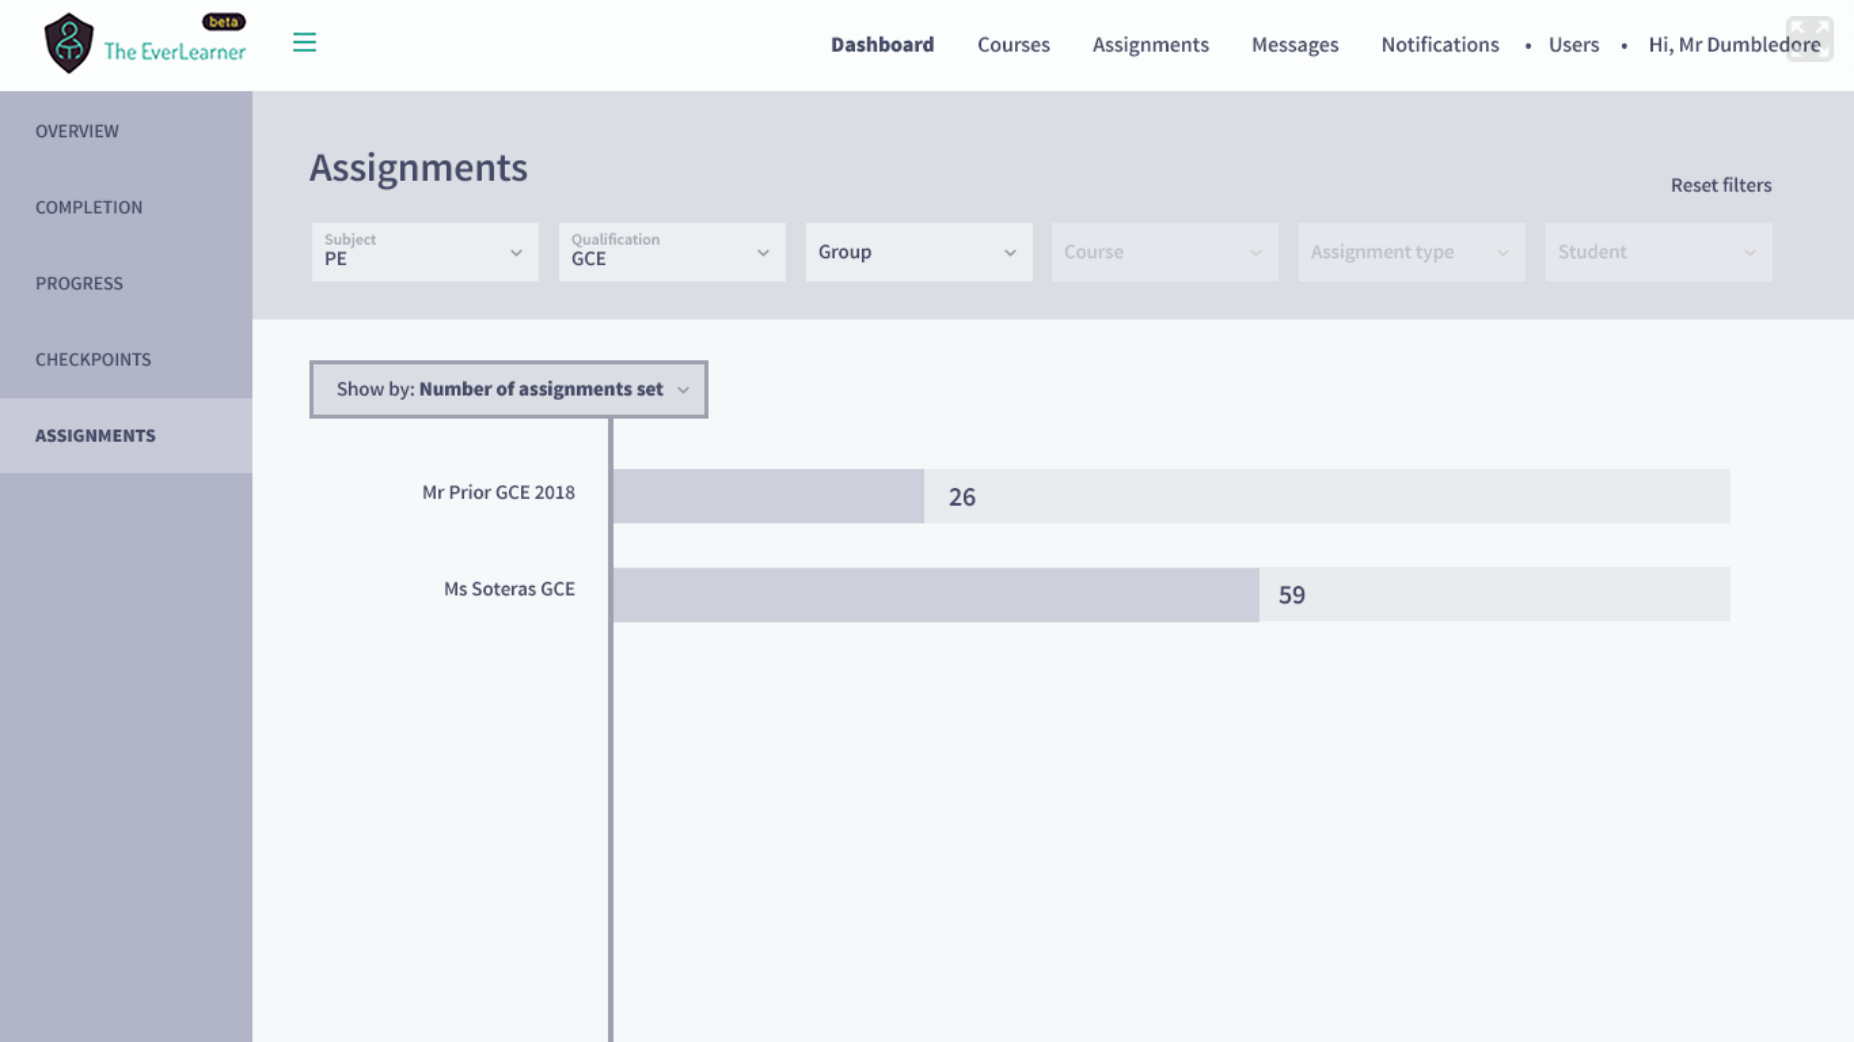
Then choose group:
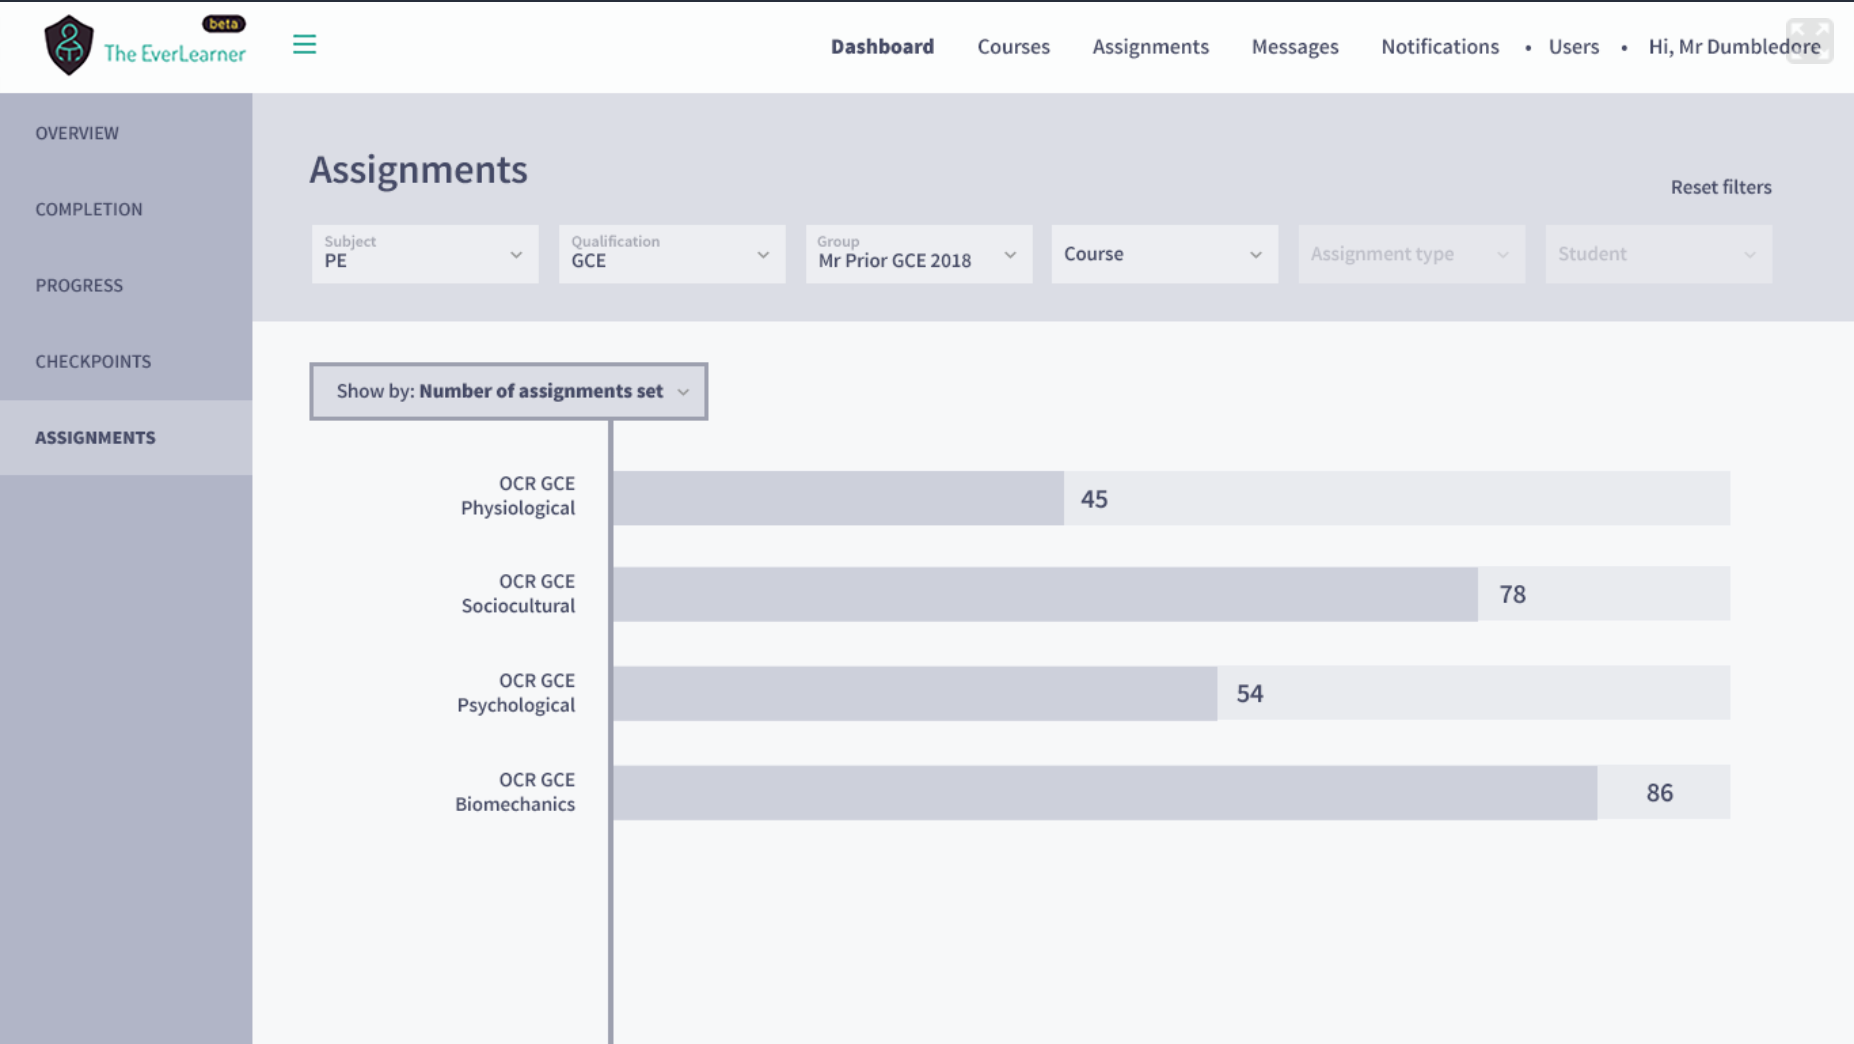
Then choose the course:
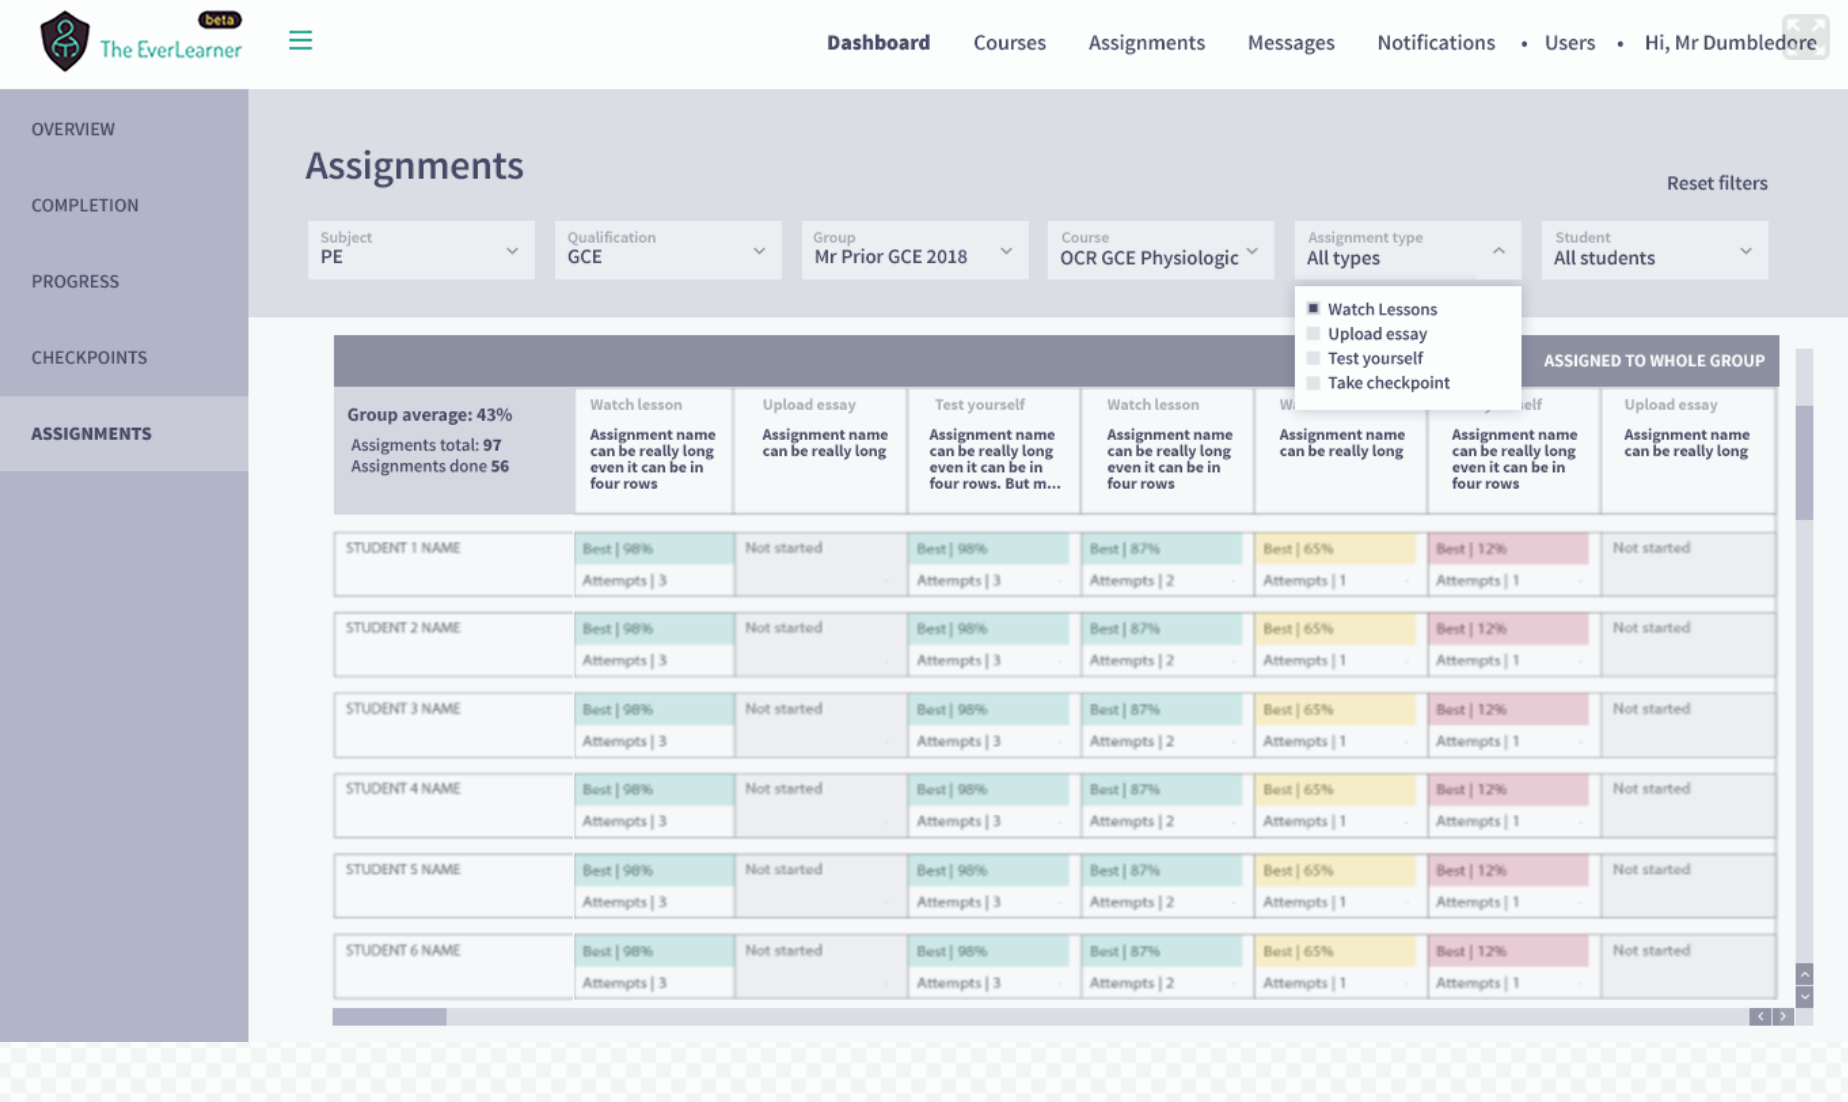
Filter by assignment type:
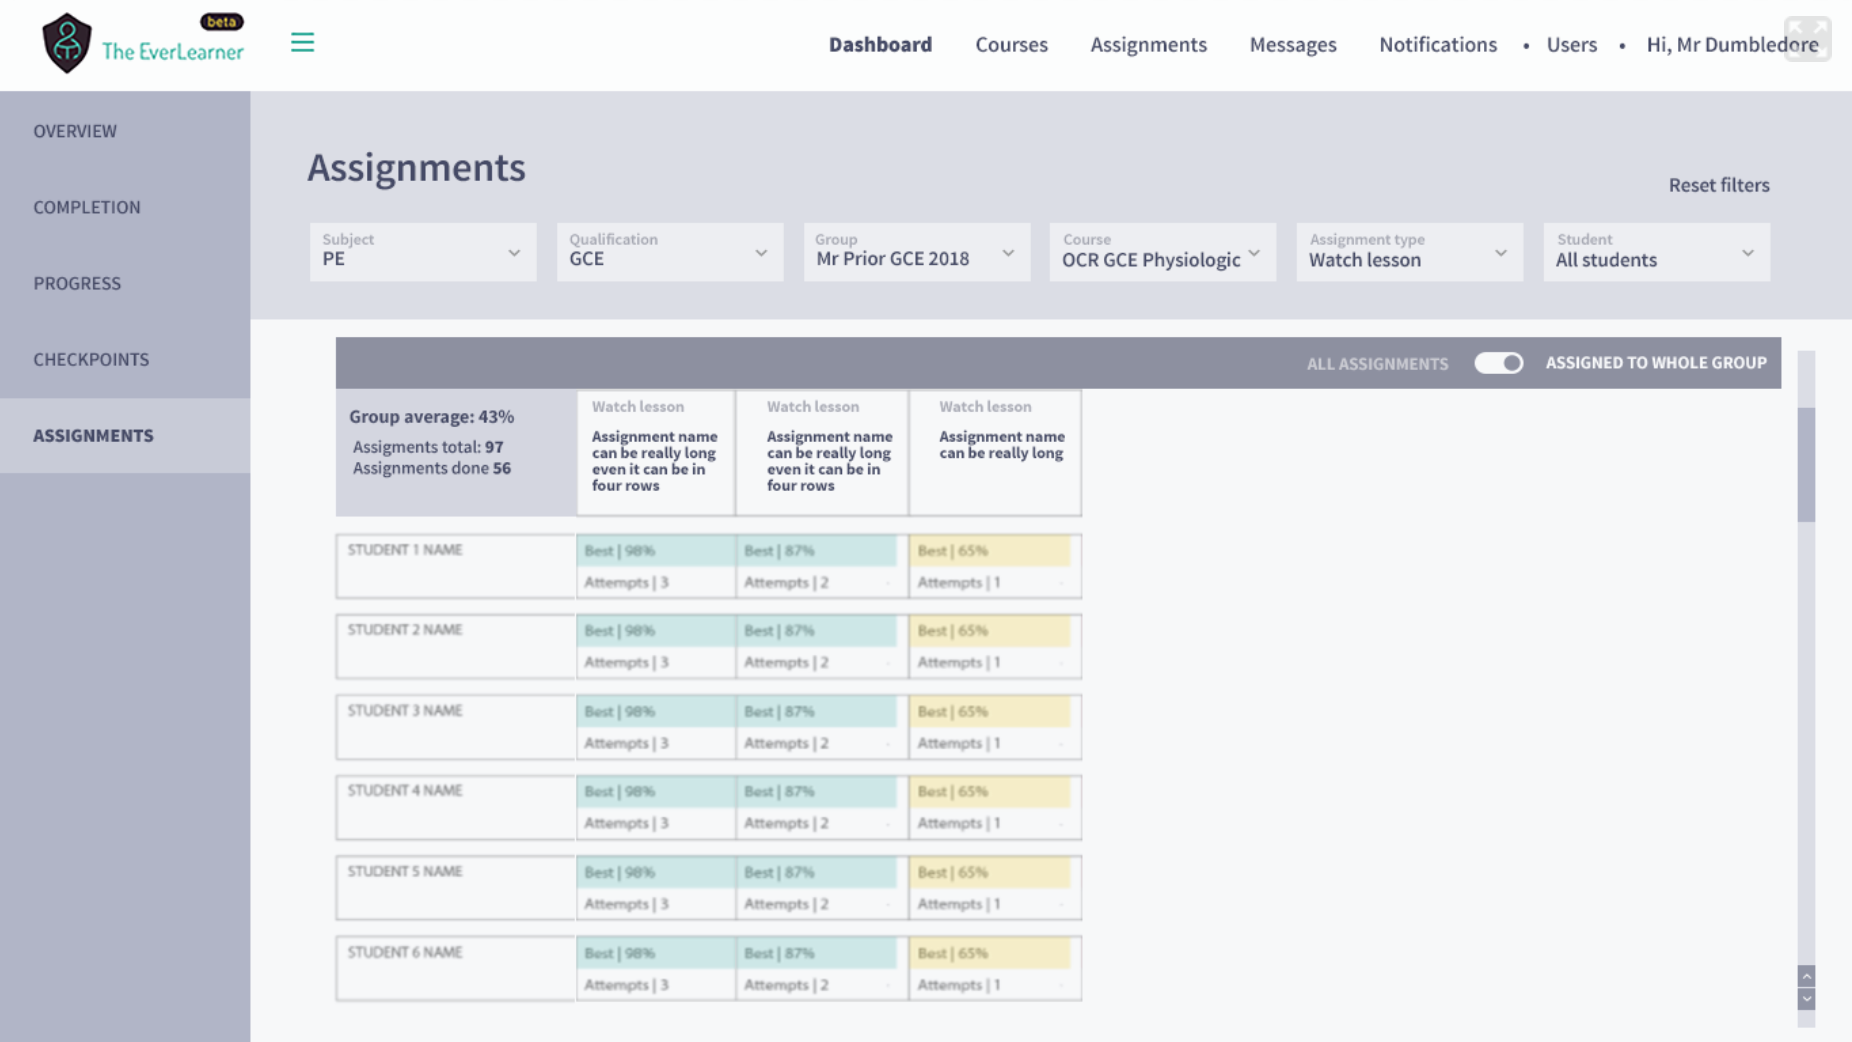
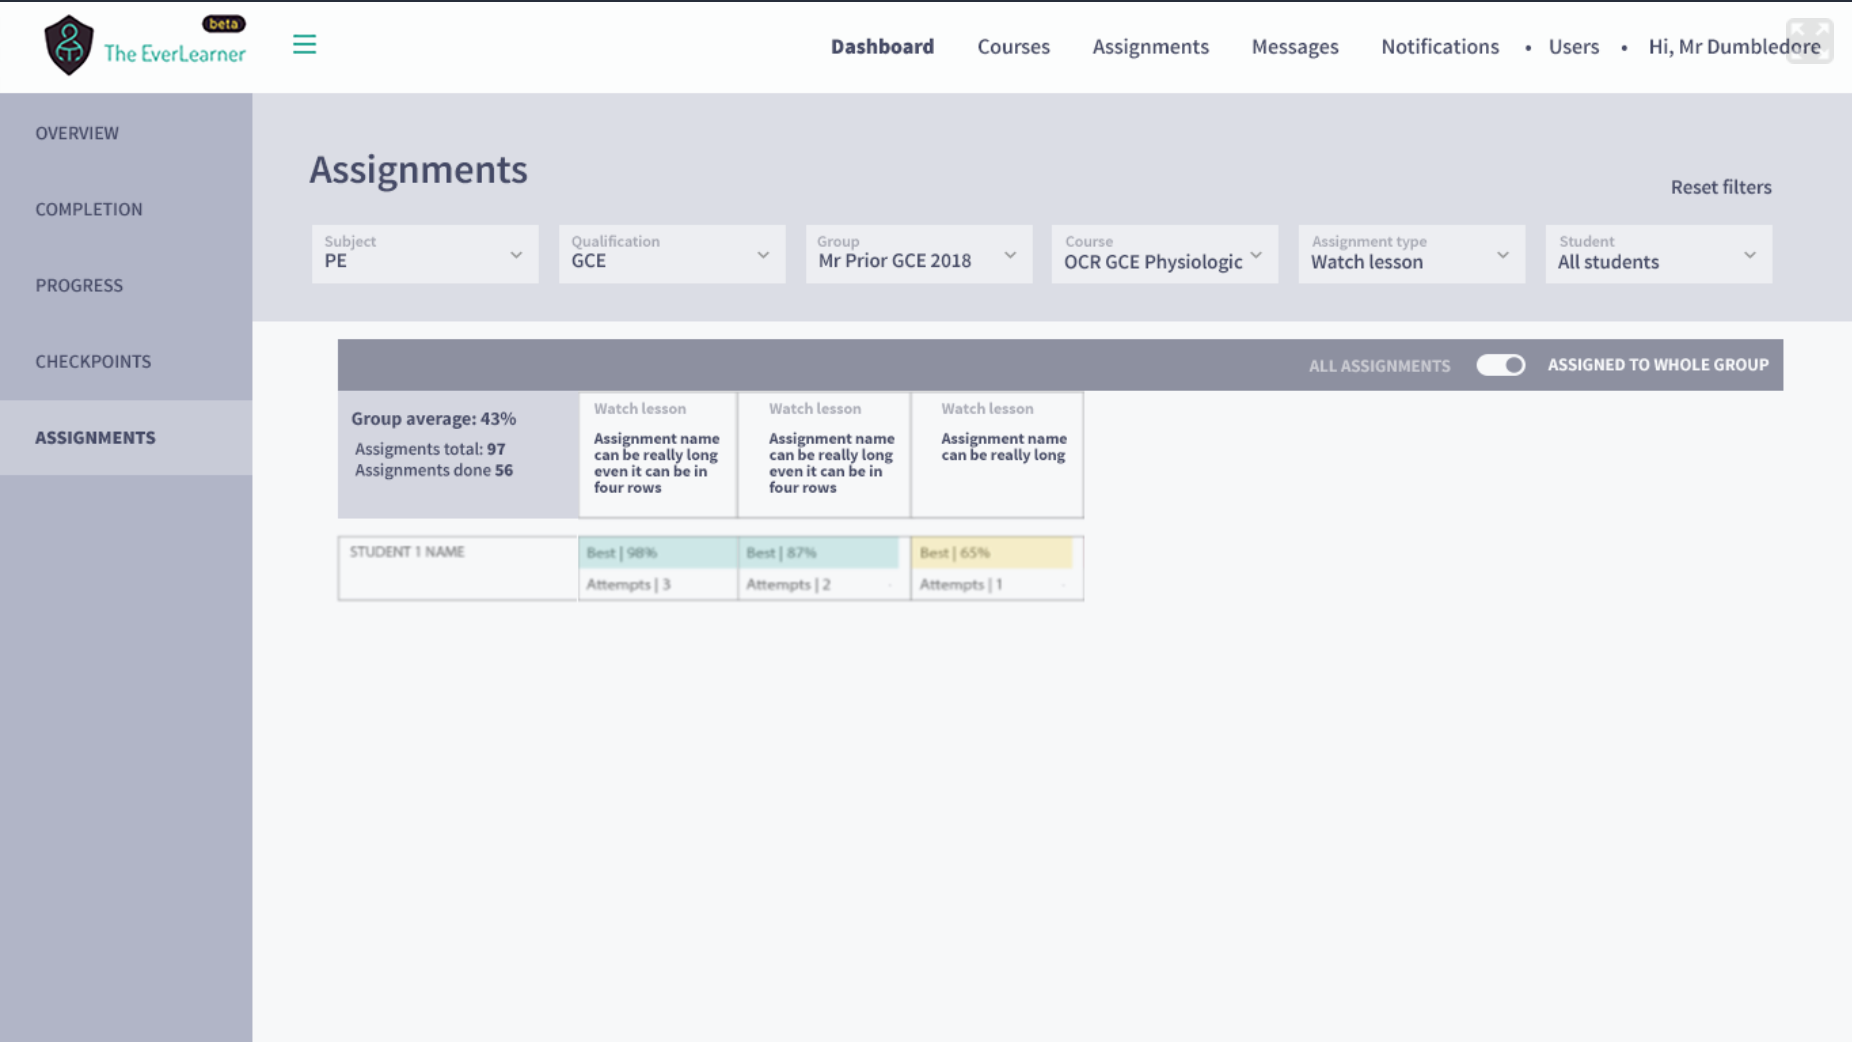
Filter by students:
Please get in touch if you have any thoughts, comments or feedback about the new dashboard. We want this to be a powerful feature which allows you to proactively see which areas students are struggling with and be there to support them at the moment they need it. We also want this to be a helpful tool to empower you to see trends in the data at individual student, group, cohort and subject level. Please let me know if you think there is anything missing!
Mike
Mike@theeverlearner.com